
Real Estate investment
- 10/07/2022
Missed our Twitter Space?
🏠 Catch up on the housing market’s downturn (and what happens next) featuring @NewsLambert and @calculatedrisk. https://t.co/EiAkvdLTi9
— FORTUNE (@FortuneMagazine) October 7, 2022
- 09/02/2022
Rising Mortgage Rates Complicate Decision on Buying Versus Renting – WSJ
- 08/02/2022
- 08/01/2022 –
US housing …. https://t.co/0QS5MDR9iz
— Tracy (𝒞𝒽𝒾 ) (@chigrl) August 1, 2022
Black Knight Mortgage Monitor: "Record-Setting Slowdown in Home Price Growth"
"Largest Monthly Inventory Gain in 12 Years" https://t.co/fjTBIQy8k7 pic.twitter.com/5Yal3Wf4Vw— Bill McBride (@calculatedrisk) August 1, 2022
Housing Inventory August 1st Update: Up 32.3% Year-over-year https://t.co/wxzeMGbXmi Here are the same week inventory changes for the last four years:
2022: 13.4K
2021: 4.4K
2020: -13.4K
2019: 2.9K pic.twitter.com/uUEGFEfznZ— Bill McBride (@calculatedrisk) August 1, 2022
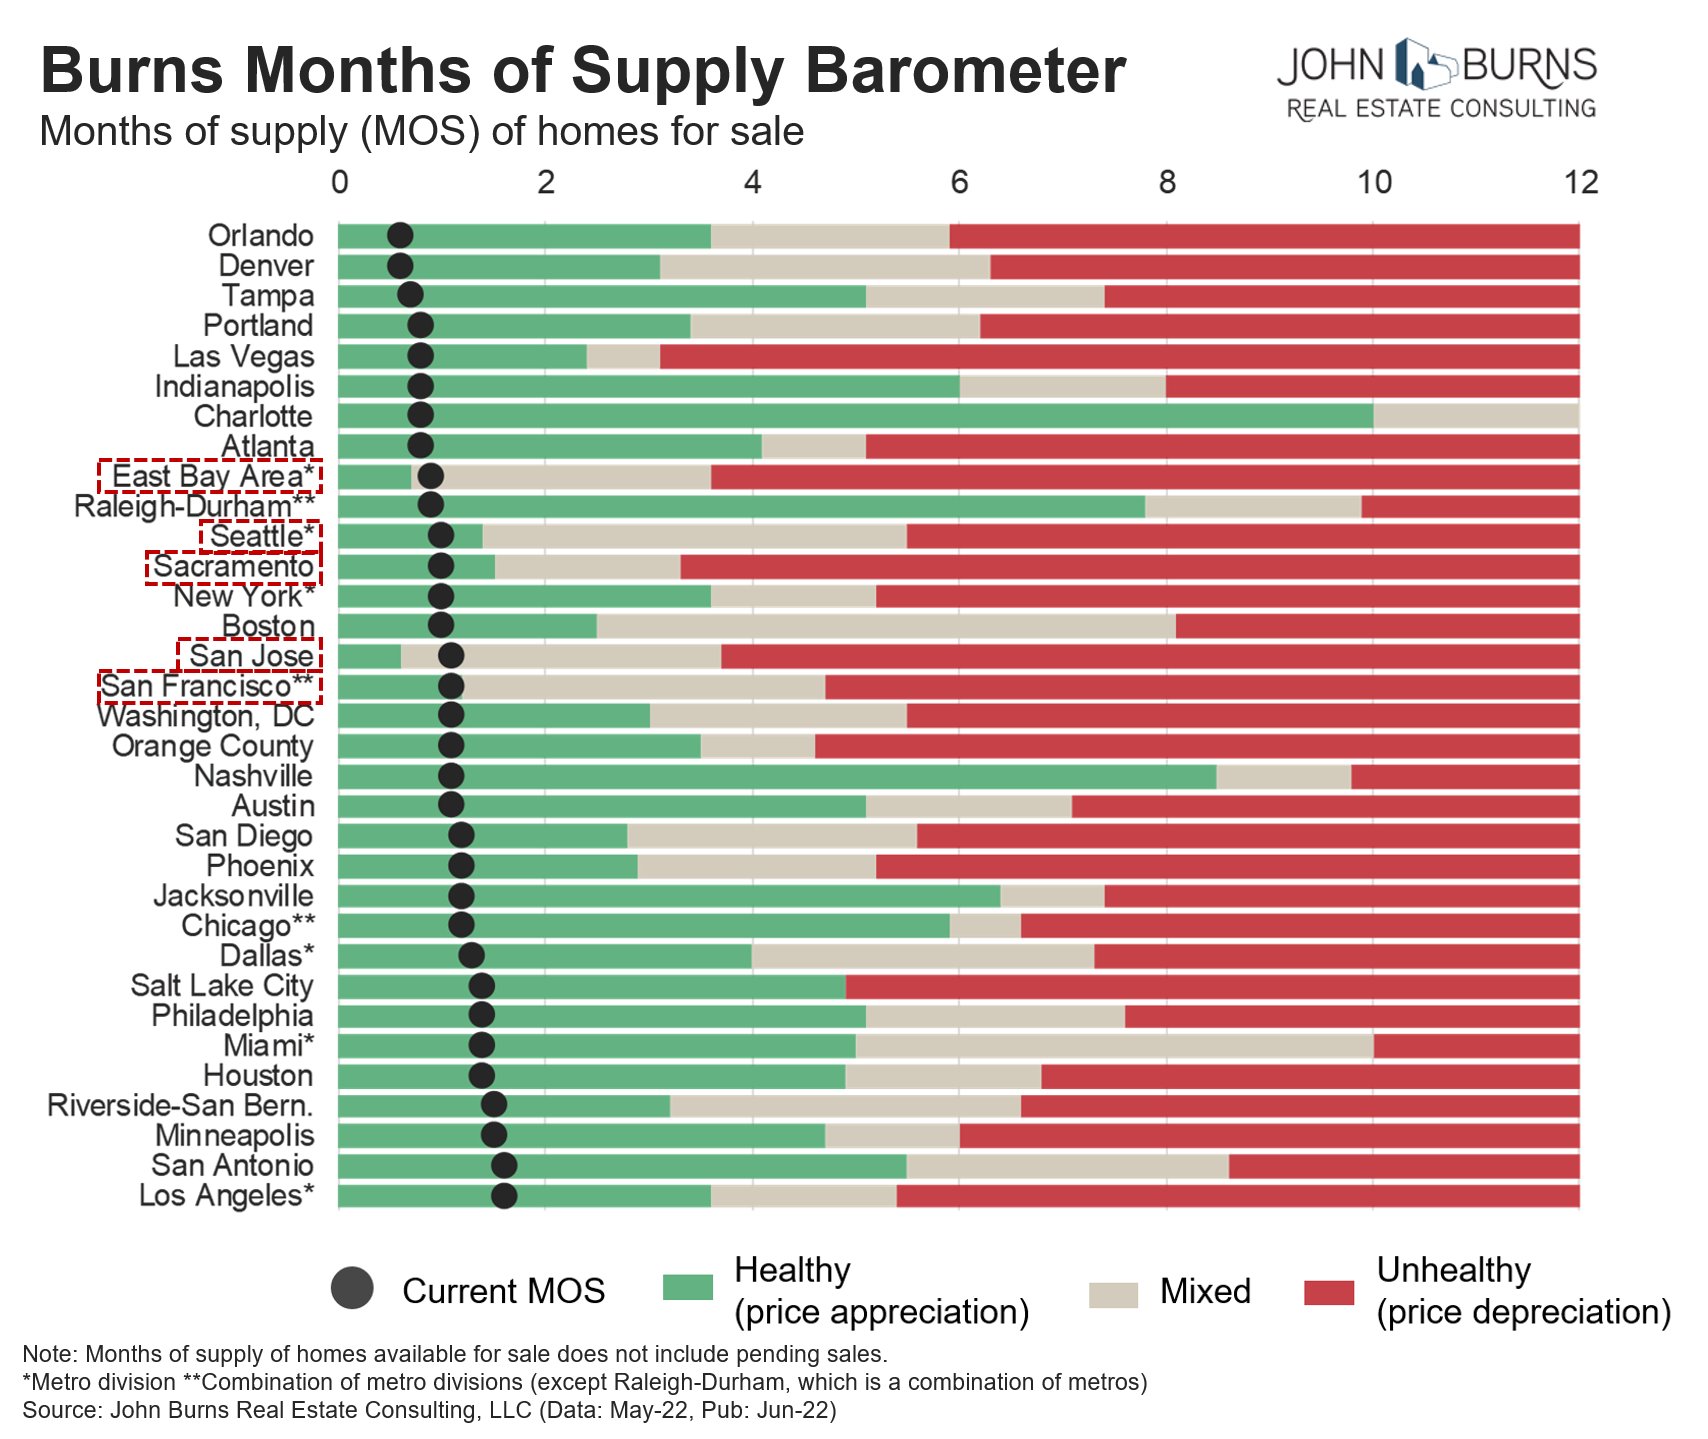
- 06/21/2022 – Listings are rising as home sales fall sharply, which will push months’ supply up fast. In many markets, it historically takes just a modest jump in months’ supply for home prices to start cooling off quickly. Take a look at Northern California and Seattle below as examples. – Watch out SD
Listings are rising as home sales fall sharply, which will push months' supply up fast. In many markets, it historically takes just a modest jump in months' supply for home prices to start cooling off quickly. Take a look at Northern California and Seattle below as examples. pic.twitter.com/q8zU5wFVET
— Rick Palacios Jr. (@RickPalaciosJr) June 20, 2022
- 05/27/2022 – maybe we have housing shortage

- 05/26/2022 – San Diego housing market
How Long Can the San Diego Housing Market Stay This Hot?
The San Diego housing market is strong, but how long will it stay that way?
The median single-family home in San Diego County reached $1 million in April, according to resale housing statistics compiled through the San Diego Multiple Listing Service by the Greater San Diego Association of Realtors
“We’ve seen prices appreciate like crazy and we have seen so much buyer demand because rates were so low so the last two years,” San Diego Realtor Destiny Roxas said.
Home prices are not expected to fall, but the rate of appreciation is expected to ease and rising interest rates will impact some neighborhoods more than others, according to many economists.
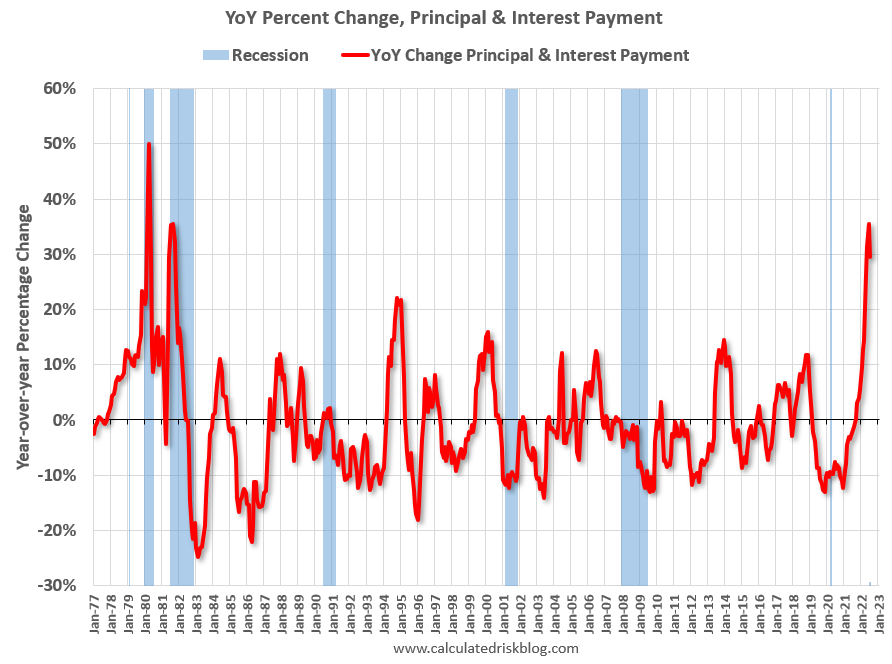
“Communities where you know the interest payment is a big part of their budget will be particularly hard hit. So, this is likely to have a different impact on a household depending on their savings, depending on their wealth, depending on the income,” UCSD Professor Allan Timmerman said.
Despite an expected cooldown in the market, experts believe the foundation of the San Diego housing market will remain strong.
- 05/26/2022 – Tilson on housing market
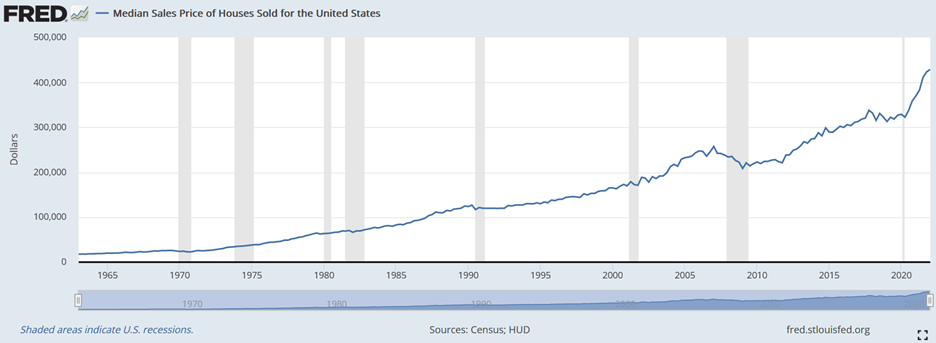
The U.S. housing market has been on fire since it bottomed during the global financial crisis…
The median sales price of a home reached an all-time high of $428,700 in the first quarter, more than double the low of $208,400 in the first quarter of 2009, as you can see in this chart going back to 1963 (source: the St. Louis Fed):
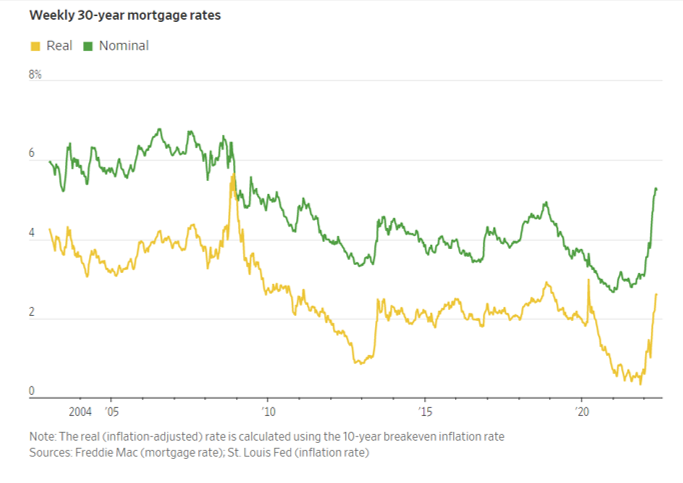
However, many folks are concerned that housing prices may fall, due mainly to rising interest rates, though they are still low by historical standards, as you can see in this chart (also from the St. Louis Fed) of the rate for a 30-year fixed rate mortgage:

However, if we zoom into the past year, you can see that after reaching an all-time low of 2.77% last August, the average rate has nearly doubled to 5.25% today:
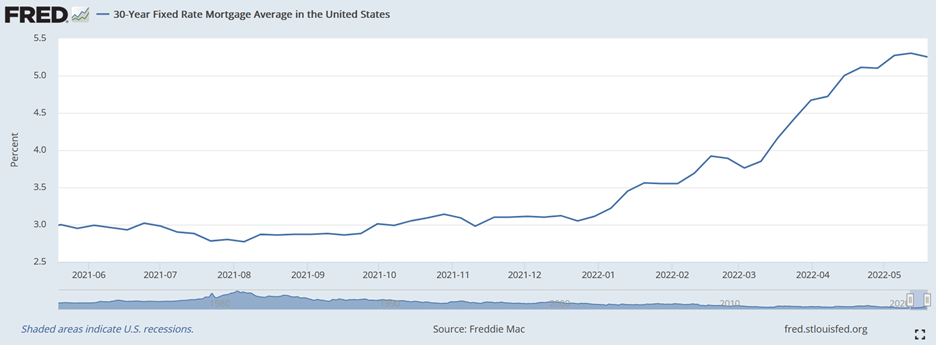
This obviously has a huge effect on what someone can afford to borrow and therefore pay for a house.
But will it be enough to cool the housing market – or even cause a crash?
My take: Yes to the cooling, but a decline in housing prices is unlikely, for reasons outlined in this in-depth Wall Street Journal article: Fed Searches for the Magic Number to Cool a Red-Hot U.S. Housing Market. Excerpt:
With a nudge from the Fed’s recent interest rate increases, mortgage rates have risen almost 2.3 percentage points since November to 5.25% last week, the steepest rise in a six-month-span in decades. In the past, that kind of increase was usually enough for home buying and construction to fall sharply. Yet home prices could still hit new highs, even with sales starting to fall. Economists at Goldman Sachs (GS) estimate housing prices will grow around 10% this year; Bank of America (BAC) forecast 15%.
“This is a market as resistant to higher interest rates as you could possibly imagine,” said Christopher Thornberg, founding partner at Beacon Economics in Los Angeles. “This is not a market that 5% interest rates are going to scare at all.”
That leaves the Fed to decide how far and how fast rates need to go up to make a dent in the housing market without triggering a painful economic slowdown. Housing has been a traditional battleground in the fight against inflation because it is sensitive to interest rates and makes up a significant part of the U.S. economy. For nearly a decade, mortgage rates below 5% gave buyers the leeway to purchase more expensive homes. Rising rates weaken that purchasing power…
Economists and those in the real-estate industry have explanations for the unrelenting demand and minimal supply accelerating housing prices nationwide: millions of Americans in their 20s and 30s reaching peak home-buying years, more work-from-home jobs in the pandemic, increased competition from investors and too little housing built in the past decade.
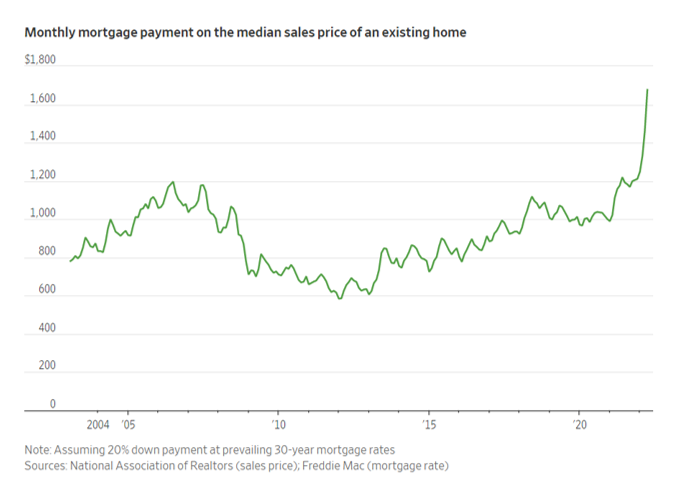
Homeowners also have an incentive to stay put. Many don’t see where they can afford to move. In April, the monthly mortgage payment on the typical home jumped to $1,475, assuming a 30-year fixed-rate mortgage with a 20% down payment, according to Zillow (Z). That is up 34% since December and 53% from April 2021…
… fewer than 10% of 1,500 prospective buyers surveyed this year said they would stop their home search because of rising mortgage rates. Shoppers in a 2018 survey, the last time mortgage rates rose to 5%, were twice as likely to say they would pull back.
“We wanted a house no matter what,” said Kendal Strong, a 31-year-old hairstylist…
Real-estate professionals said employer permission for many white-collar employees to work remotely has allowed buyers to seek housing in more distant, less expensive locales. That helped lift demand for housing – and prices – in more affordable cities and towns.
“If you think you’re going to cut home-buying demand, just instantly, by raising rates, that works so much better when someone was looking in San Francisco and had to stay there,” said Glenn Kelman, chief executive at Redfin. “But when mortgage rates go from 3% to 4% to 5%, people can just go from San Francisco to Ohio, to Arkansas, to Louisiana”…
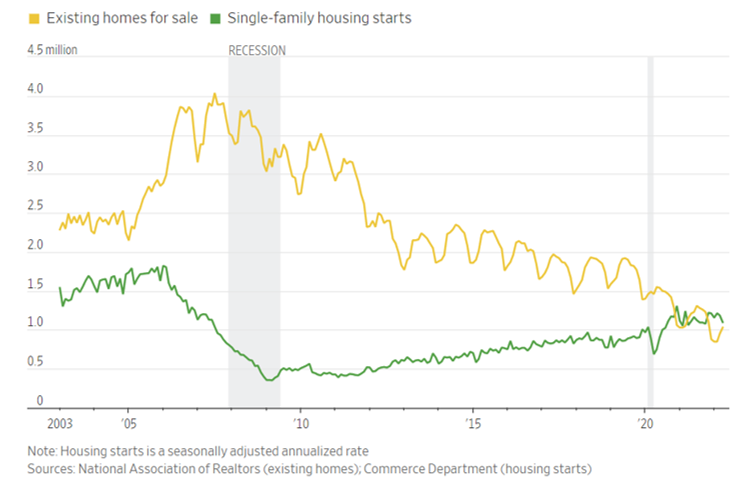
Home builders have increased production but are hamstrung by volatile material costs, supply-chain troubles and shortages of skilled tradespeople and available land. “The Fed is determined to put out this fire,” Douglas Bauer, chief executive at Nevada-based home builder Tri Pointe Homes Inc., told analysts last month. “But there is just no supply.”
For the decade following the 2007-2009 recession, new-home construction in the U.S. slowed. The homeowner vacancy rate has since fallen to 0.8%, the lowest in 66 years of record-keeping. The rental vacancy rate is near its lowest level since 1984. At the end of April, 1.03 million homes were listed for sale nationally, equal to a 2.2-month supply at the current sales pace, compared with a historical average of 5.7 months for that time of year, according to NAR.
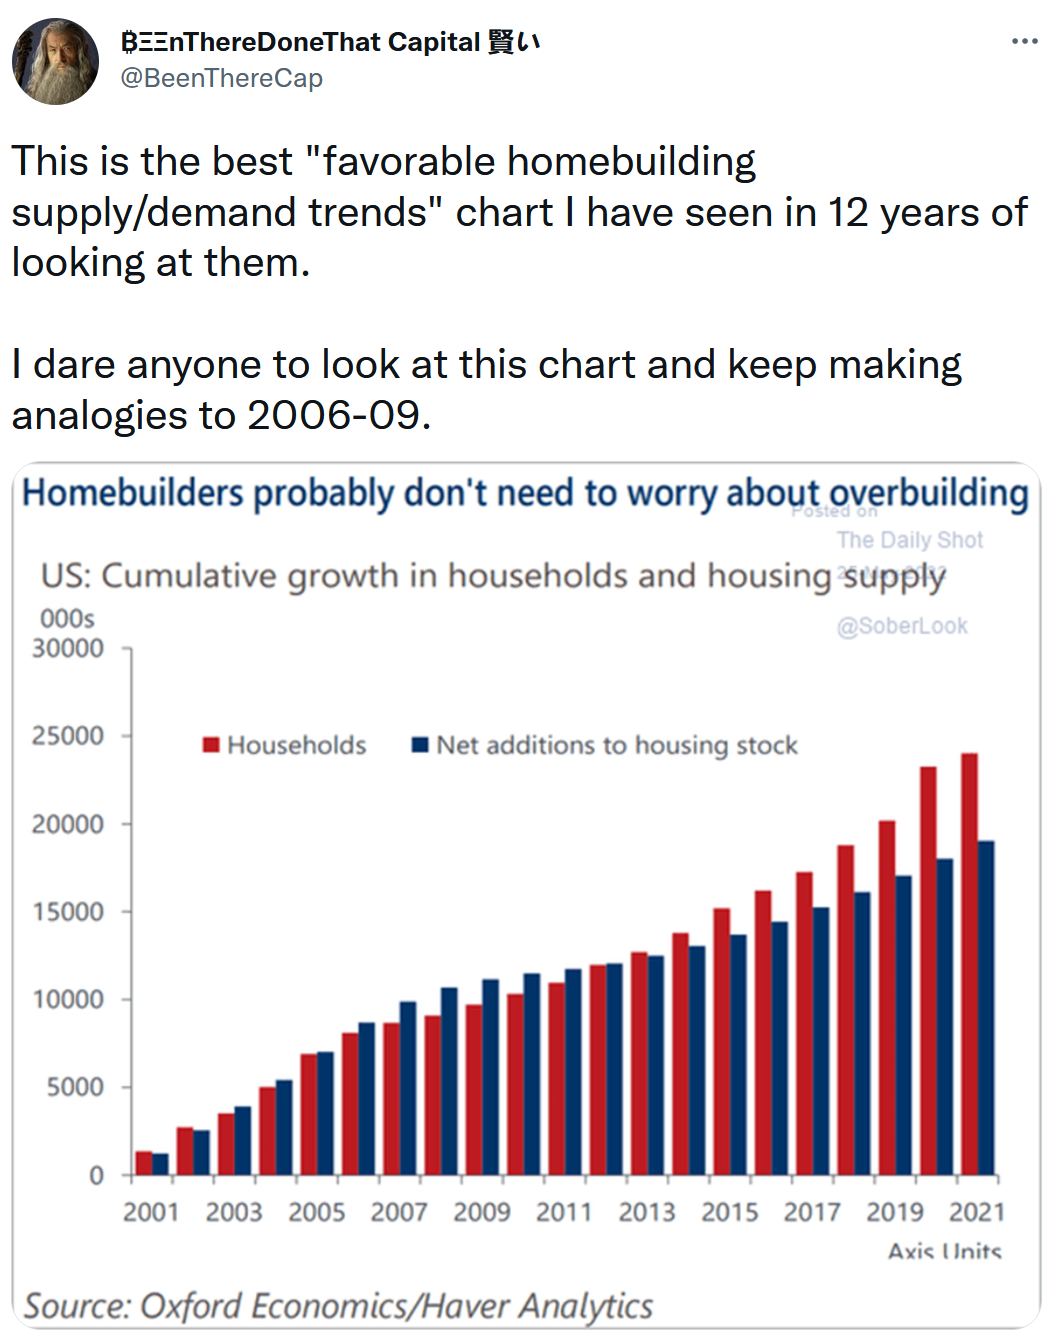
Here’s another interesting chart someone tweeted:
Lastly, if you want to take an in-depth dive into the housing market, I recommend this five-part series by Voss Capital, The Big Long? A Deep Dive on U.S. Housing:
- Part 1 – Where Is the Inventory?
- Part 2 – What’s Driving Demand?
- Part 3 – Homeowner Balance Sheets and Historical Declines in Home Values
- Part 4 – What Slow Down? Recent Commentary from Builders and Building Product Companies
- Part 5 – Affordability
Excerpt:
In our view, the current housing market is a textbook example of supply and demand imbalances driving up prices. The demand that has resulted in bidding wars and rapid home price appreciation isn’t coming from euphoric real estate speculation. The ongoing wave of demographic driven demand is crashing into a structural housing supply shortage after we spent over a decade underbuilding following the financial crisis. While we don’t want to try to predict housing prices, we think the calls for a housing price crash on par with or even worse than 2007/2008 are sensationalistic as we believe there is a strong demand floor for the foreseeable future…
While we agree that affordability is something to keep an eye on and quickly becoming a concern in some markets, much of it stems from the supply/demand imbalance we entered 2020 with rather than rampant speculation or anything of the sort. The good news is that homebuilders are building where people want to live, where the demographics support it and where employment is growing. Despite persistent supply chain issues continuing to slow down the pace of completions there are currently more than 800,000 single family home under construction. This provides a line of sight to much needed new supply which should serve to help correct the supply/demand imbalance and ease the rapid home price increases in the most in demand cities.
- 05/25/2022 – It is common for lenders to lay off workers when interest rates rise, like they did in 2018, and then hire again when rates fall. However, in the run-up to 2008, mortgage companies instead lowered lending standards to keep volume high, laying the seeds for the global financial crisis. This time around, lenders have kept their standards for mortgage loans relatively strict. – so there is still no sign of housing financial crisis
Rising Rates Are Battering Mortgage Lenders – WSJ
Nonbank lenders in particular are laying off staff, selling servicing rights and otherwise trying to survive
It is common for lenders to lay off workers when interest rates rise, like they did in 2018, and then hire again when rates fall. However, in the run-up to 2008, mortgage companies instead lowered lending standards to keep volume high, laying the seeds for the global financial crisis. This time around, lenders have kept their standards for mortgage loans relatively strict.
- 05/24/2022 – housing is still in shortage (~1.7 millions), but One indicator of market balance—the difference between the financial advantage of home buying versus renting—is starting to move against buying. At the end of last year, the ratio of U.S. home prices to rents reached its highest since 2007, according to the Dallas Fed.
Fed Searches for the Magic Number to Cool a Red-Hot U.S. Housing Market – WSJ
The central bank must decide on an interest rate that will cap sky-high price growth without triggering a painful economic slowdown
“This is a market as resistant to higher interest rates as you could possibly imagine,” said Christopher Thornberg, founding partner at Beacon Economics in Los Angeles. “This is not a market that 5% interest rates are going to scare at all.”
That leaves the Fed to decide how far and how fast rates need to go up to make a dent in the housing market without triggering a painful economic slowdown. Housing has been a traditional battleground in the fight against inflation because it is sensitive to interest rates and makes up a significant part of the U.S. economy. For nearly a decade, mortgage rates below 5% gave buyers the leeway to purchase more expensive homes. Rising rates weaken that purchasing power.
Short supply
Home builders have increased production but are hamstrung by volatile material costs, supply-chain troubles and shortages of skilled tradespeople and available land. “The Fed is determined to put out this fire,” Douglas Bauer, chief executive at Nevada-based home builder Tri Pointe Homes Inc., told analysts last month. “But there is just no supply.”
For the decade following the 2007-2009 recession, new-home construction in the U.S. slowed. The homeowner vacancy rate has since fallen to 0.8%, the lowest in 66 years of record-keeping. The rental vacancy rate is near its lowest level since 1984. At the end of April, 1.03 million homes were listed for sale nationally, equal to a 2.2-month supply at the current sales pace, compared with a historical average of 5.7 months for that time of year, according to NAR.
Housing shortage in supply
About 1.64 million single-family and multifamily homes were under construction in April on a seasonally adjusted basis, the highest level in data going back to 1970, according to census data. Many are likely to be completed by the end of the year. Mr. Bauer, the home builder, points out that many of those single-family homes are already sold, which means they won’t fix the current supply shortage.
John Burns Real Estate Consulting calculates the U.S. is short around 1.7 million housing units given population growth and household formation. Mr. Khater, the Freddie Mac economist, estimated that the U.S. needed 3.8 million dwelling units as of late 2020.
Homeowners who refinanced their mortgages at ultralow rates have less incentive to sell, also crimping supply. Almost 98% of outstanding 30-year conventional mortgages have a rate below 5%, according to Freddie Mac.
One indicator of market balance—the difference between the financial advantage of home buying versus renting—is starting to move against buying. At the end of last year, the ratio of U.S. home prices to rents reached its highest since 2007, according to the Dallas Fed.
Mr. Waller, the Fed governor, and his wife, frustrated in their search, finally threw in the towel. Last month, they signed an apartment lease.
- 04/02/2022 – rate hike deters house buyers somewhat
https://www.barrons.com/articles/housing-market-mortgage-rates-home-prices-buyers-51648765685
First-Time Home Buyers Are Simply Walking Away: ‘We’ve Been Backed Into a Corner’
- 12/26/2021 – from Calculatedrisk – Inventory declined due to a combination of potential sellers keeping their properties off the market during a pandemic, and a pickup in buying due to record low mortgage rates, a move away from multi-family rentals and strong second home buying (to escape the high-density cities). And at the same time, demographics were favorable for home buying (a large cohort has moved into the peak home buying years). The timing of the seasonal bottom will be important this year. If inventory bottoms seasonally in December, we might see inventory increase YoY later in 2022. However, if inventory doesn’t bottom until March or April, we will probably see another crazy year with little inventory.
10) Housing Inventory: Housing inventory decreased sharply during the pandemic to record lows in early 2021. Will inventory increase as the pandemic subsides, or will inventory decrease further in 2022?
This might be one of the most important economic questions for 2022!
Here are a few times when watching existing home inventory helped my analysis.
Starting in January 2005, I was very bearish on housing, but I wasn’t sure when the market would turn. Speculative bubbles can go on and on. However, the increase in inventory in late 2005 (see red arrow on graph below) helped me call the top for house prices in 2006.
Several years later, in early 2012, when many people were still bearish on housing, the plunge in inventory in 2011 (blue arrow on graph below) helped me call the bottom for house prices in early 2012 (see The Housing Bottom is Here).
 |
Four years ago, in January 2018, I was quoted in a Bloomberg article that included a bearish outlook for housing. I disagreed, and the steady level of inventory helped (see orange arrow above):
Bill McBride, who runs the Calculated Risk blog and also called the crash, doesn’t think home prices are inflated this time around. Unlike in 2005, lenders are acting responsibly and the Wild West of real estate speculation hasn’t returned, he said. There is less to speculate on, too. Compared with the overbuilding that preceded the bust, today’s pace of construction isn’t fast enough, he said.
“Lending standards are still pretty good,” McBride said, and he doesn’t expect mortgage rates to “take off” in the short term.
And in December 2018, I disagreed with Professor Shiller A comment on Professor Shiller’s “The Housing Boom Is Already Gigantic. How Long Can It Last?”. My conclusion:
No big deal, and definitely not a “gigantic” boom in house prices.
In 2019, when several commentators were bearish on housing, I pointed out there was no sharp increase in housing inventory (like in 2005), and that was one of the reasons I remained optimistic on housing and the economy (correctly!).
And the sharp decline in inventory during the pandemic (green arrow) was an indicator that price appreciation would increase. Inventory declined due to a combination of potential sellers keeping their properties off the market during a pandemic, and a pickup in buying due to record low mortgage rates, a move away from multi-family rentals and strong second home buying (to escape the high-density cities). And at the same time, demographics were favorable for home buying (a large cohort has moved into the peak home buying years).
According to the National Association of Realtors® (NAR), inventory decreased to 1.11 million in November from 1.23 million in October. Note that inventory was already pretty low in 2017, 2018 and 2019.
Prior to 2020, two of the key reasons inventory was low:
1) A large number of single-family home and condos were converted to rental units. In 2015, housing economist Tom Lawler estimated there were 17.5 million renter occupied single family homes in the U.S., up from 10.7 million in 2000. Many of these houses were purchased by investors. Most of these rental conversions were at the lower end, and that limited the supply for first time buyers.
2) Baby boomers are aging in place (people tend to downsize when they are 75 or 80). The leading edge of the boomers are now turning 76 or so, and the boomers selling will probably gradually increase over the next 10 years (see: Housing and Demographics: The Next Big Shift)
Inventory is not seasonally adjusted, and usually inventory decreases from the seasonal high in mid-summer to the seasonal lows in December and January as sellers take their homes off the market for the holidays.
 |
The second graph shows the year-over-year (YoY) change in reported existing home inventory and months-of-supply. Note: Months-of-supply is based on the seasonally adjusted sales and not seasonally adjusted inventory.
Inventory was down 13.3% year-over-year in November compared to November 2020. Months-of-supply at 2.1 months in November is very low, but still above the record low of 1.9 months set in December 2020 and January 2021. That record will be tested next month.
In 2020, inventory really declined due to a combination of potential sellers keeping their properties off the market during a pandemic, and a pickup in buying due to record low mortgage rates and favorable demographics (a large cohort has moved into the peak home buying years), a move away from multi-family rentals, and strong second home buying. In 2021, mortgage rates remained low, demographics remained favorable, and we saw a significant increase in investor buying.
Alternative measures of inventory
Mostly I focus on inventory as reported by the NAR. However, I also look at inventory from local markets (this showed inventory was down about 26% year-over-year).
Another source is Altos Research that tracks inventory weekly.
 |
This inventory graph is courtesy of Altos Research.
As of December 17th, inventory was at 326 thousand (7-day average), compared to 454 thousand for the same week a year ago. That is a decline of 28.2%.
As housing economist Tom Lawler has noted, the local MLS data shows even a larger decline in active inventory (the NAR appears to include some pending sales in inventory). Lawler noted:
“As I’ve noted before, the inventory measure in most publicly-released local realtor/MLS reports excludes listings with pending contracts, but that is not the case for many of the reports sent to the NAR (referred to as the “NAR Report!”), Since the middle of last Spring inventory measures excluding pending listings have fallen much more sharply than inventory measures including such listings, and this latter inventory measure understates the decline in the effective inventory of homes for sale over the last several months.”
Although the NAR is reporting inventory is down 13.3% YoY, it is very likely that active inventory is down 26% to 28% YoY.
Conclusion
First, it appears we will see record low inventories over the next few months. This suggests we will see further strong price gains over the next several months (with low inventories).
In 2021, the NAR showed inventory bottomed in January and (inventory bottoms in December), however the local MLS data, and the Altos Research data, showed inventory bottomed even later than usual – in March or early April 2021. If 2022 follows the normal seasonal pattern, we will see inventory increasing by February (and maybe even in January).
The timing of the seasonal bottom will be important this year. If inventory bottoms seasonally in December, we might see inventory increase YoY later in 2022. However, if inventory doesn’t bottom until March or April, we will probably see another crazy year with little inventory.
Second, the outlook depends on the course of the pandemic. Each new wave of the pandemic has driven down interest rates, and that has made homebuying more affordable (even as prices increased sharply). Making the assumption that the pandemic will be mostly over by mid-2022 (due to a combination of vaccines and therapeutics), we can make a few general predictions:
1. Mortgage rates will increase in 2022 (from the current 3.25% for a 30-year fixed rate), and this will make house prices less affordable. This should dampen some of the buying frenzy.
2. Sellers will be more willing to list their homes as the pandemic subsides, and price increases slow.
The bottom line is inventory will probably set new record lows over the next couple of months, and then inventory will likely increase YoY later in the year. However, it seems unlikely that inventory will be back up to the 2017 – 2019 levels. Inventory is always something to watch!
- 12/02/2021 – Three percent of borrowers, or approximately 264,000 homeowners, are now delinquent on mortgages after their programs expired, and 38,000 are in active foreclosure. inventory-starved market needs about 1 million more homes.
Thousands could soon lose – or sell – their homes as Covid mortgage bailouts expire
- Hundreds of thousands of homeowners could soon lose or sell their homes as Covid-related mortgage bailout programs expire.
- There are not a lot of options for borrowers who lost too much income or their businesses during the pandemic, although they could take advantage of high equity in their homes and sell.
- That has not been the case so far. A data firm found that nearly a third of borrowers who go start the foreclosure process with at least 40% equity in their homes go to foreclosure anyway.
- “They may have equity, but then it’s a matter of where they going? Where are they going to go? Where are they going to purchase?” said a housing counselor.
Hundreds of thousands of homeowners remain in a tough spot, however. Three percent of borrowers, or approximately 264,000 homeowners, are now delinquent on mortgages after their programs expired, and 38,000 are in active foreclosure.
- Mortgage rates rose sharply this week, and it could be the beginning of an upward trend.
- The average rate on the popular 30-year fixed mortgage just crossed back over 3% early this week and then jumped 9 basis points Thursday to 3.1%. The rate was 2.93% a week ago.
- A decline in Covid cases is partly behind the rise in rates, as are the Federal Reserve’s latest comments about interest rates and bond purchases.
- Some 12.3 million American households were formed from January 2012 to June 2021, but just 7 million new single-family homes were built during that time.
- Single-family home construction is running at the slowest pace since 1995.
- PulteGroup just lowered its Q3 and full-year guidance for home closings, citing supply chain disruptions
The U.S. is short 5.24 million homes, an increase of 1.4 million from the 2019 gap of 3.84 million, according to new research from Realtor.com.
The U.S. Census found that 12.3 million American households were formed from January 2012 to June 2021, but just 7 million new single-family homes were built during that time.
Single-family home construction has suffered from a severe labor shortage that began well before the pandemic but was then exacerbated by it. Supply chain disruptions in the past year have pushed prices for building materials higher, and as pandemic-induced demand soared, prices for land increased as well.
“The pandemic has certainly exacerbated the U.S. housing shortage, but data shows household formations outpaced new construction long before Covid. Put simply, new construction supply hasn’t been meeting demand over the last five years,” said Realtor.com chief economist Danielle Hale. “Millennials, many of whom are now in their 30s and even 40s, have debunked the industry’s ‘renter generation’ expectations.”
- 09/14/2021 – Is the U.S. in another housing bubble? – it does not look like a bubble
Home prices in the U.S. have climbed at a record pace during the pandemic. The median home price reached over $363,000 in June 2021, a 23.4% year-over-year increase. Many of the houses are being sold above their asking price, often entirely in cash with bidding wars becoming the new norm to weed out the competition. So is America in another housing bubble? And what are the signs that can help investors predict an oncoming crash? Watch the video to find out.
- 09/14/2021 – in terms of housing price to median household income, we are close to housing bubble. However,
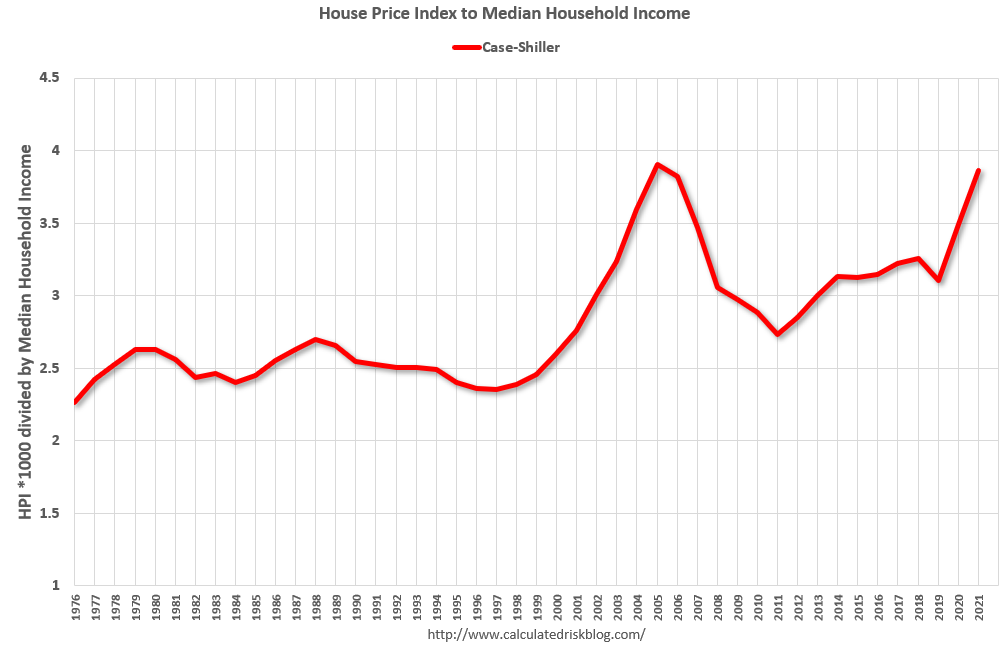
By this measure, house prices are close to the bubble peak.
However, as I noted in The Housing Conundrum:
- Demographics are very favorable for home buying.
- Mortgage rates are near record lows.
- Lending standards have been fairly solid.
- There hasn’t been a huge increase in equity extraction, meaning that most homeowners have substantial equity in their homes (so even if prices decline, there won’t be cascading price declines).
- And housing inventory is near record lows.
So, by some measures, house prices seem high, but the recent price increases make sense from a supply and demand perspective.
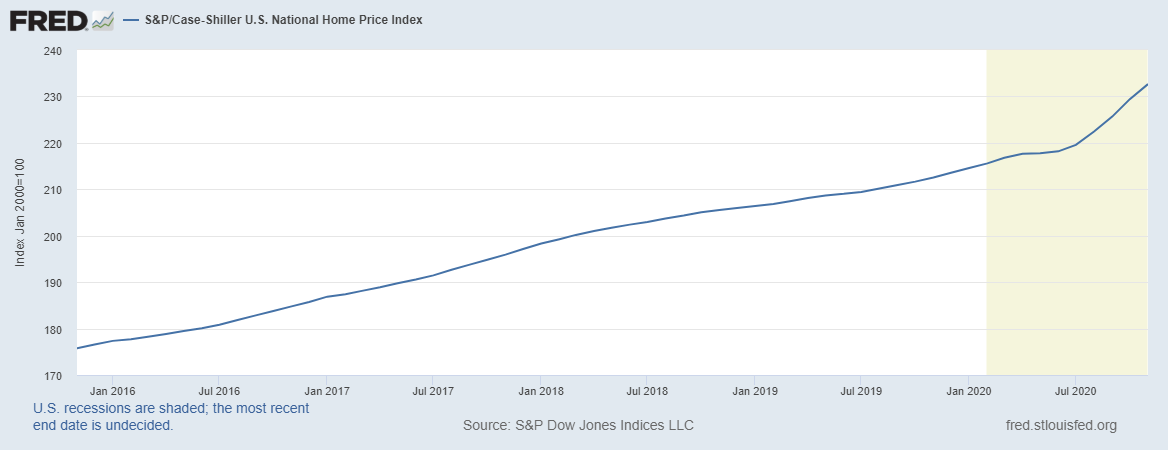
- 06/29/2021 – S&P CoreLogic Case-Shiller national index of average home prices up 14.6%
U.S. Home-Price Growth Rose to Record in April – WSJ
S&P CoreLogic Case-Shiller national index of average home prices up 14.6%
U.S. home prices surged at their fastest pace ever in April as buyers competing for a limited number of homes on the market pushed the booming housing market to new records.
The S&P CoreLogic Case-Shiller National Home Price Index, which measures average home prices in major metropolitan areas across the nation, rose 14.6% in the year that ended in April, up from an 13.3% annual rate the prior month. April marked the highest annual rate of price growth since the index began in 1987.
Home prices have surged this year due to low mortgage-interest rates, which have spurred strong demand, and a continued shortage of homes for sale. Many homes are getting multiple offers and selling above asking price. The home-price surge is widespread around the U.S., affecting buyers and sellers in big cities, suburbs and small towns.
The median existing-home sales price in May rose almost 24% from a year earlier, topping $350,000 for the first time, the National Association of Realtors said earlier this month.
- 06/21/2021 – shortage of building new houses might contribute partially to the recent surge in home prices. In addition, the supply shortage became especially acute in the past year. Builders slowed construction in some regions last spring and delayed land purchases because of the Covid-19 pandemic. In addition, low mortgage-interest rates and an increase in remote work led to a surge in demand for single-family housing. And many homeowners delayed or canceled plans to list their homes for sale.
U.S. Housing Market Needs 5.5 Million More Units, Says New Report – WSJ
Construction of new homes in the last two decades lagged behind historical levels, contributing to a recent surge in home prices
Construction of new housing in the past 20 years fell 5.5 million units short of long-term historical levels, according to a new National Association of Realtors report, which is calling for a “once-in-a-generation” policy response.
The industry lobbying group said it hopes the report, which was released Wednesday, persuades lawmakers to include housing investments in any infrastructure package.
U.S. builders added 1.225 million new housing units, on average, each year from 2001 to 2020, according to the report, which was prepared for NAR by Rosen Consulting Group LLC. That figure is down from an annual average of 1.5 million new units from 1968 to 2000.
The 5.5 million-unit deficit includes about two million single-family homes, 1.1 million units in buildings with two to four units and 2.4 million units in buildings of at least five units, the report says.
“The scale of the problem is so large,” said David Bank, senior vice president of Rosen Consulting Group and one of the report’s authors. “We need affordable [housing], we need market-rate, we need single-family, we need multifamily.”
The report also says that from 2010 to 2020, new-home construction fell 6.8 million units short of what was needed to meet household-formation growth and replace units that were aging or destroyed by natural disasters.
The supply shortage became especially acute in the past year. Builders slowed construction in some regions last spring and delayed land purchases because of the Covid-19 pandemic. In addition, low mortgage-interest rates and an increase in remote work led to a surge in demand for single-family housing. And many homeowners delayed or canceled plans to list their homes for sale.
- 04/03/2021 –
Buying a Home in 2021: How to Budget, Prepare for Bidding Wars and Surging Prices – WSJ
Selling a Home in 2021: Refinancing Mortgages, Seller’s Market, What You Need to Know – WSJ
The Housing Market Is Crazier Than It’s Been Since 2006 – WSJ
- 03/16/2021 -Rising costs for lumber and other materials are causing new home contracts to be canceled, according to the National Association of Homebuilders.
Homebuyers canceling contracts as costs soar
Rising mortgage rates are also creating headwinds
Rising costs for lumber and other materials are causing new home contracts to be canceled, according to the National Association of Homebuilders.
Lumber costs have surged more than 170% over the past year, adding around $24,000 to the cost of a new home. Concrete, metal products, appliances, and other expenses are also increasing due to supply chain disruptions caused by COVID-19 shutdowns.
The problem of higher materials costs is being compounded by a rise in mortgage rates. The rate on a 30-year fixed mortgage has risen by 30 basis points over the past month to a seven-month high of 3.24%. Rates hit a record low of 2.85% in November.
- 03/12/2021 – The average rate on a 30-year mortgage rose to 3.05% for the week of March 11
Mortgage Rates Are Rising. Read This Before You Refinance. – WSJ
If you haven’t refinanced yet, is it still worth it? Homeowners have a lot to consider before signing that application.
The average rate on a 30-year mortgage rose to 3.05% for the week of March 11, according to Freddie Mac. While that is higher than historic lows reached last summer, homeowners with rates above 4% could still benefit from refinancing.
- 03/04/2021 – 30-Year Mortgage Rate Tops 3%. Mortgage rates tend to move in the same direction as the yield on the 10-year Treasury, which has been rising.
30-Year Mortgage Rate Tops 3% for First Time Since July – WSJ
Rate hits 3.02% after falling for most of 2020. Rising rates have already started to weigh on mortgage applications in recent weeks.
Americans who purchased new homes or refinanced their mortgages over the past few months may have done so at just the right moment.
The average rate on a 30-year fixed-rate mortgage rose to 3.02%, mortgage-finance giant Freddie Mac said Thursday. It is the first time the rate on America’s most popular home loan has risen above 3% since July and the fifth consecutive week it has increased or held steady.
The recent upward moves paint a clear contrast: More vaccinations in the U.S. and recent progress on the latest coronavirus relief bill have brightened investors’ outlook on the economy, a key variable in determining borrowing rates.
Mortgage rates tend to move in the same direction as the yield on the 10-year Treasury, which has been rising. Treasury yields rise when investors feel confident enough in the economy to forgo safe-haven assets such as bonds for riskier ones including stocks. Last week, the yield hit its highest level in a year.
- 02/12/2021 – some reasons housing market is so surprisingly hot: Fleeing small apartments, buying vacation homes or simply looking for a change of scenery amid the crushing boredom of lockdowns, people scrambled to buy houses amid the pandemic, spurring bidding wars and supercharging real-estate markets across the country. At the same time, inventory dropped as many homeowners hesitated to list their properties in the pandemic. The result is that much of the country saw a price spike and bidding wars, brokers said, leaving buyers with little to choose from. In these conditions, many are tempted to waive inspections or skip other due diligence they would normally perform before buying a home.
These People Rushed to Buy Homes During Covid. Now They Regret It.
Hot real-estate markets across the U.S. led to a number of buyers snapping up homes without performing due diligence
- 02/12/2021 – good direction for housing
|
- 02/10/2021 – FHFA extends an additional three months of forbearance
Borrowers with GSE Mortgages Allowed to Extend Forbearance
- 02/09/2021 – 2.72 million homes remain in forbearance will continue to drop if jobs are back gradually. homeowners’ credit profiles, when they originated their loans, were excellent. This is very different from that of 2008. Only when we see interest rate jumps significantly, we will see housing market to be cooled down: By Aug. 31, 2021, we will have a much different conversation about the state of U.S. economics. Hopefully, by then, the 10-year yield will have hit 1.33% and higher.
The last stand for forbearance housing market crash bros?
Is there any hope for them with the recent job numbers?
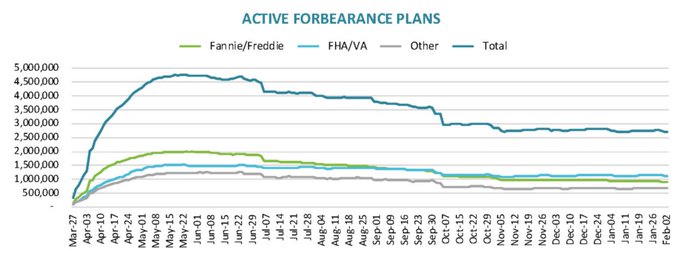
In 2021, a lingering symptom of the economic sickness we suffered in 2020 is forbearance. Not the forbearance plans themselves, which allowed mortgage holders to delay their payments for many months, but the fact that 2.72 million homes remain in forbearance and can therefore be considered at risk. Forbearance will have to end at some point, and when it does, couldn’t all these homes flood the housing market at once, driving prices down and scaring would-be homeowners away from purchasing?
We know the current status of the housing market in America is vigorous, if not hot. The MBA purchase application data is growing at a trend of 12% year over year. This growth is 1% higher than the peak of what I forecasted for 2021, up until March 18.
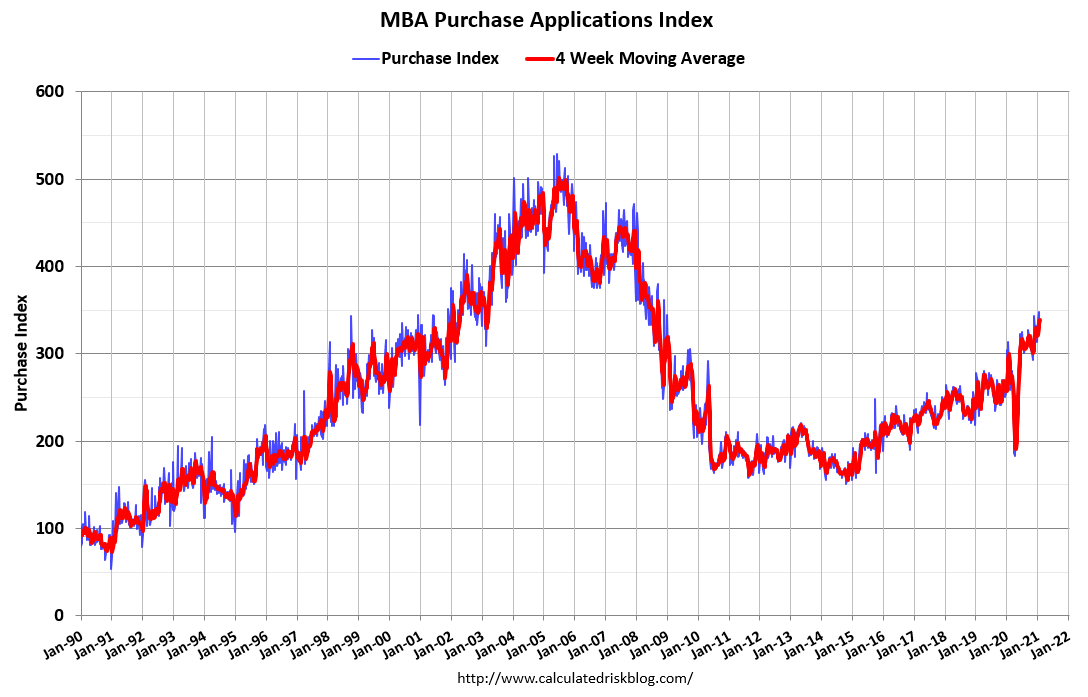
Today, inventory levels are at all-time lows, and the purchase application data index is above 300. This means home price growth is getting too hot! Just look at the difference 2020 brought into the data lines.
The question remains: will all this strength in the housing market dampen or erase the risk of having all those homes in forbearance once forbearance ends? Here are three reasons you don’t have to worry.
First, the latest chart from BlackKnight shows us that the number of homes in forbearance has been decreasing. We are well off the peak. I expect this number to decline as our employment picture improves; however, there will be a lag period for this data line to show more improvement.
Second, and this is critical to the story, homeowners’ credit profiles, when they originated their loans, were excellent. The previous expansion had the best loan profiles I have seen in my life. These buyers, especially those who purchased from 2010-2017, have fixed low debt costs due to low mortgage rates, with rising wages and nested equity. As home prices continue to grow beyond expectations, these homeowners have added another year of gains to their nested equity.
In this way, the current housing market backdrop is unlike the housing credit bubble years when loan profiles weren’t healthy, and we had a debt leverage speculative market. Last year, I wrote about the forbearance crash bros to outline their problems with their crash thesis. Here is a link to one of those articles.
And the third reason we don’t have to worry about a crash when forbearance ends is J.O.B.S.!
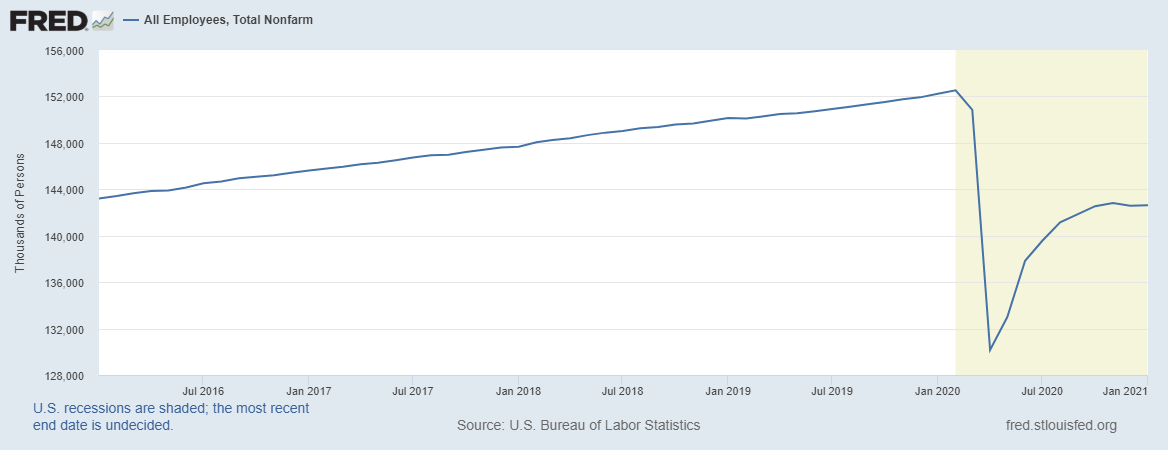
The primary reason I believe the crash thesis of the housing market bubble boys turned forbearance crash bros will fail is that jobs are coming back. The employment gains started last year and have continued. We have gained 12,470,000 jobs – and that was not in the forecast of the housing bubble boys.
The February 2020 nonfarm payroll data, which accounts for most workers, had roughly 152,523,000 employed workers. We got as low as 130,161,000 employed workers during the Covid crisis peak and are now back to 142,631,000. We are still short 9,892,000 jobs, which is more than the jobs lost during the great financial crisis.
Sadly, but to be expected, the last two jobs report combined were negative. We will not get back to the employment level we had in February 2020 while COVID-19 is with us, which prevents some sectors from operating at full capacity. So job growth remains limited until we get more Americans vaccinated.
And the job storm is coming. We are vaccinating people faster every week that goes by. We just need time, and then all the lost jobs will come back and then some. Even those 3.5 million permanent jobs lost will be replaced.
This isn’t 2008 all over again. That housing market recovery was slow, but today our demographics are better, and our household balance sheets are healthier. The fiscal and monetary assistance now is hugely improved from what we saw after 2008. We have everything we need to get America back to February 2020 jobs levels; we just need time.
I am convinced that the number of homes under forbearance will fall as more people gain employment. Expect the forbearance data to lag the jobs data, but they will eventually coincide.
Disaster relief is coming, and then when we can walk the earth freely, look for the government to do a stimulus package to push the economy along. By Aug. 31, 2021, we will have a much different conversation about the state of U.S. economics. Hopefully, by then, the 10-year yield will have hit 1.33% and higher. Wait for it!
Think about that next time you see someone hawking a housing market bubble crash thesis. All the jobs will come back in time, and we will all be walking in the sun again without a mask. Until then, we need to support government programs, like disaster relief and programs that help homeowners in forbearance get out of it, and help renters too. Let’s not leave any American behind in this war against COVID-19.
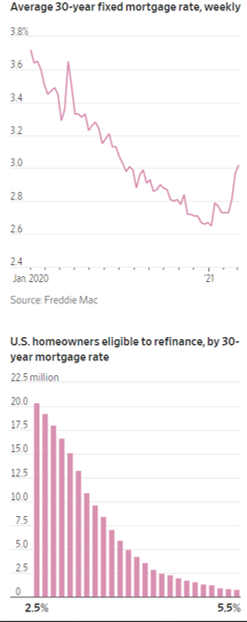
- 02/08/2021 – J.P. Morgan analysts predict that $500 billion in mortgage-backed securities will be issued this year by U.S. agencies, such as Ginnie Mae, Fannie Mae, and Freddie Mac, most of which would be absorbed by the Fed’s $480 billion annual agency MBS purchases. All of which has pushed mortgage rates to record lows—2.73% for a conventional 30-year fixed-rate loan, a hair above the nadir of 2.65% in late December. Steven Ricchiuto, chief economist at Mizuho Securities USA, expects the Fed to begin to taper its purchases, albeit not until the second half of 2022. He looks for the central bank to reduce its buying incrementally, while long-term rates rise, “to avoid excess speculation in the housing market.
Home-Price Surge Says Inflation Is Real. The Fed Clings to Illusion It Isn’t.
Central bankers routinely deny any connection between their monetary policies and asset prices, even though that’s how those policies are transmitted to the real economy. “Pay no attention to that man behind the curtain,” they all but insist, as the lightning and smoke jumps and hisses while they manipulate the controls, believing that they’re shrouded from view.
But when asked about the housing market—specifically, the jump in prices and what pace of increase might induce a change in the Fed’s $40 billion monthly purchases of agency mortgage-backed securities—Powell demurred from connecting the two.
He called the double-digit annual surge in home prices a “passing phenomenon” related to the pandemic. “There’s a one-time thing happening with people who are spending all of their time in their house. And they’re thinking either I need a bigger or I need another house, and a different house. Or a second house, in some cases. So there’s a one-time shift in demand that we think will get satisfied, also that will call forth supply. And we think that those price increases are unlikely to be sustained for all of those reasons.”
J.P. Morgan analysts predict that $500 billion in mortgage-backed securities will be issued this year by U.S. agencies, such as Ginnie Mae, Fannie Mae, and Freddie Mac, most of which would be absorbed by the Fed’s $480 billion annual agency MBS purchases. The Fed’s $2.07 trillion MBS portfolio throws off $80 billion a month that has to be reinvested—at a rate twice as much as its net new purchases—which adds to the volume of securities being absorbed.
All of which has pushed mortgage rates to record lows—2.73% for a conventional 30-year fixed-rate loan, a hair above the nadir of 2.65% in late December, according to Freddie Mac. Filling “the monetary punch bowl is fueling rampant home price appreciation,” the AEI said. It looks for its home price appreciation index to accelerate to a 14% year-over-year rate in 2021, from 11% in December and 6% a year earlier. The strongest gains will be in the top and middle-high tiers favored mainly by trade-up buyers. But the low and medium-low tiers, which attract mostly first-time purchasers, are likely to see affordability suffer, even in regions that previously have been more affordable, it added.
As noted above, Powell has called the home-price surge “a passing phenomenon” that “will call forth supply” to meet demand. The AEI contends that won’t be so easy. Restrictive land-use regulations in states such as California are holding down housing construction. New supply is forthcoming in the South and Southwest, which is attracting in-migration from the work-from-home trend.
Given all this, the AEI wonders what justification there is for the Fed to continue purchasing agency mortgage securities—effectively subsidizing an economic sector that’s booming and thus putting houses out of reach for many first-time buyers.
Indeed, Steven Ricchiuto, chief economist at Mizuho Securities USA, expects the Fed to begin to taper its purchases, albeit not until the second half of 2022. He looks for the central bank to reduce its buying incrementally, while long-term rates rise, “to avoid excess speculation in the housing market,” he writes in a research report. “Memories of the financial crisis remain very fresh in the minds of regulators some 12-to-14 years after the fact,” he adds.
- 01/16/2020 – Good to invest in strip centers than malls
Strip Centers Shine as Some Shoppers Sour on Malls
Grocery store-anchored or not, the throwback shopping centers appeal for proximity, convenience