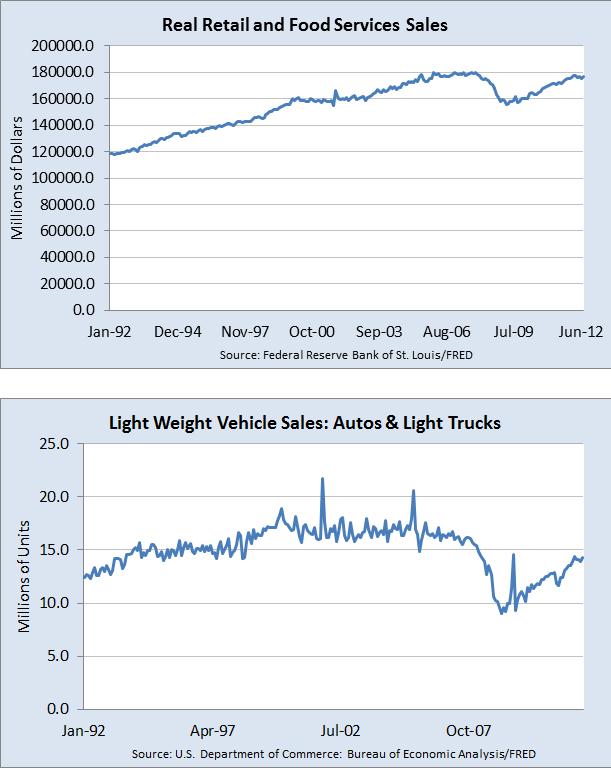
In my opinion, there are six immediate proxies to indicate the future economic trends, i.e. (1) Job openings from BLS; (2) Job creation from Gallup; (3) Help wanted online from The Conference Board; (4) temporary help services from BLS; (5) Retail and food services; and (6) Light weight vehicle sales (autos and light truck). Over the long term, equity prices are driven by fundamental of current and future anticipated economic strength.
- Job openings from BLS are shown in the chart below. The continued rise in the TNF job openings indicates the steady upward trend of job market after 2008~2009 recession.
- Job creation (index) from Gallup is shown as follow. Gallup’s Job Creation Index is the net of Gallup’s Job Market measure, subtracting the percentage of workers who say their employer is letting people go and reducing the size of its workforce from the percentage who say their employer is hiring new workers and expanding the size of its workforce. Weekly results are based on telephone interviews with approximately 4,000 working adults; margin of error is ±2 percentage points. The data clearly shows that the index is approaching the 2008 high before recession.
- Help wanted online (along with numbers of unemployment) from The Conference Board is shown in the chart below. The number of unemployment is heading downward, even though it is still much higher than the low of 2005~2007. This indicates a recovery scenario which is stagger. On the other hand, the HWOL climbs up steadily and much higher than the peak in 2007. This designates a strong demand of job market.
- The temporary help services and non-farm job openings from BLS are shown as follow. We can see that THS is a leading indicator for NFJO (1) about 1 ~1.5 years prior to the employment highs and (2) about 2 ~3 months prior to the employment lows.
 The continual rise in THS foretells a continual rise in employment for the next 1yr or so. As the employment number is a precursor to equity price trends and peaks 0.5 ~ 1 year prior to equity market peaks, this means that equity price might continue to climb for the next 6 months or one year.
- The retail and food services sales are close to the 2007~2008 peak which indicates strong consumer sentiments and foretells robust profit for the retail industries. In addition, autos and light trucks rebounds very well and heads to the peaks in 2002~2006.
So in sum, all signs continue to indicate the economic moderate recovery. And nothing so far indicates an imminent recession.


