VIX, VIX Futures and VIX Options
VIX Futures
http://cfe.cboe.com/education/vixprimer/introduction.aspx
- Introduction to VIX Futures
- Contract Specifications
- VIX Futures Quotes and Vendor Tickers
- Fine Points of Final Settlement
- Performance of VIX Futures
- Fair Value of VIX Futures
- Stacking and Rolling VIX Futures Positions
- From VIX Futures to the Term Structure of Implied Volatility
- Trading the Direction of Implied Volatility
- Implied Volatility Spreads
- Hedging Market Risk and Portfolio Diversification
- Hedging Implied Volatility Risk
- Hedging or Spreading against Realized Volatility Risk
- How is VIX Calculated? Step-by-Step Numerical Calculation
- The Theory behind the VIX Calculation
- VIX Volatility and Black-Scholes Volatility
- Mathematical Derivation of VIX
- VIX Bibliography
- Characteristic Patterns of VIX
- Relationship between VIX and Other Assets
- VIX and Realized Volatility
How Does the CBOE’s VIX® Index Work? how-does-the-vix-index-work
- While S&P 500 option premiums generally move opposite to the S&P 500 itself they sometimes go their own way. For example, if the market has been on a long bull run without a pullback institutional investors will become increasingly concerned that a correction is overdue and start bidding up the price of puts—leading to a rising VIX in spite of a rising S&P. Historically 20% of the time the VIX moves in the same direction as the S&P 500—so please don’t claim the VIX is “broken” when you see the two markets move in tandem.
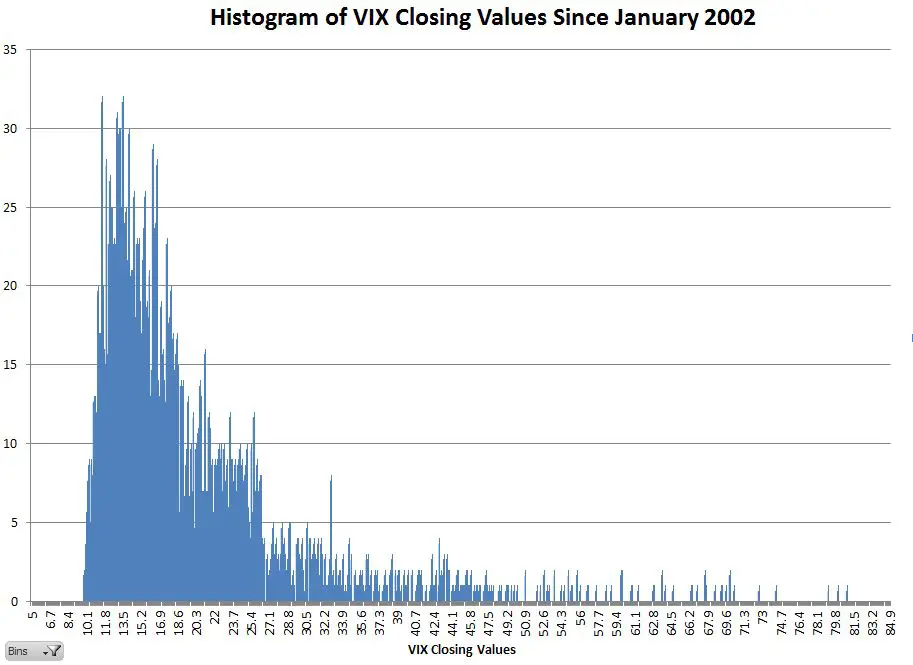
- The daily percentage moves of the VIX tend to be around 4 times the percentage moves of the S&P 500, but unlike the stock market, the VIX stays within a fairly limited range. The all-time intraday high is 89.53 (24-Oct-2008) and the all-time intraday low is 9.39 (15-Dec-2006) with the current methodology. Within this 10 to 1 range option premiums run from incredibly expensive to dirt cheap. It’s unlikely that the VIX will go much below 9 because option market makers won’t receive enough premium to make it worth their while. At the high-end things go could go higher (if the VIX had been available in the October 1987 crash it would have peaked around 120), but at some point investors refuse to pay the premium and switch to alternatives (e.g., just selling their positions if they can). The chart below shows the historical distribution of VIX values since 2002.
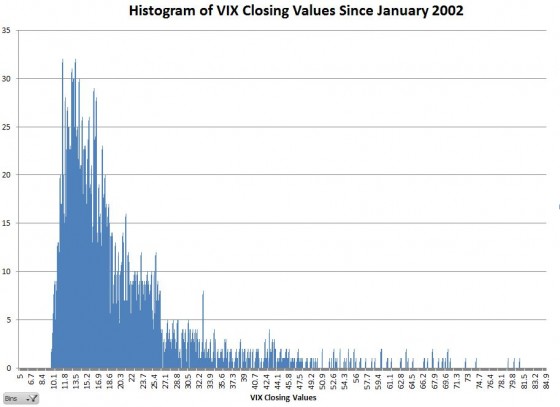 Data Source: CBOE