
To understand interest rate, rate spread and economic activity is critical for me to understand where the stock market and economy will head to.
Borrowed from Davidson
“Davidson” submits:
There is one group which believes rising rates are bad for economic activity while another group believes they signal economic strength. Both groups miss the key ingredient of the rate impact on economic activity. The key to understanding the interest rate impact on economic activity has 2 parts. The 1st part comes from understanding the rate spread between short-term capital vs. long-term capital. The 2nd part comes from having a long-term investment focus as opposed to a short-term trading focus. The reason I write about the short-term/long-term so often is because the media’s daily focus is nearly exclusively short-term with one current event (or another) threatening one collapse (or another) when none of these events seem to have any long-term impact whatsoever.
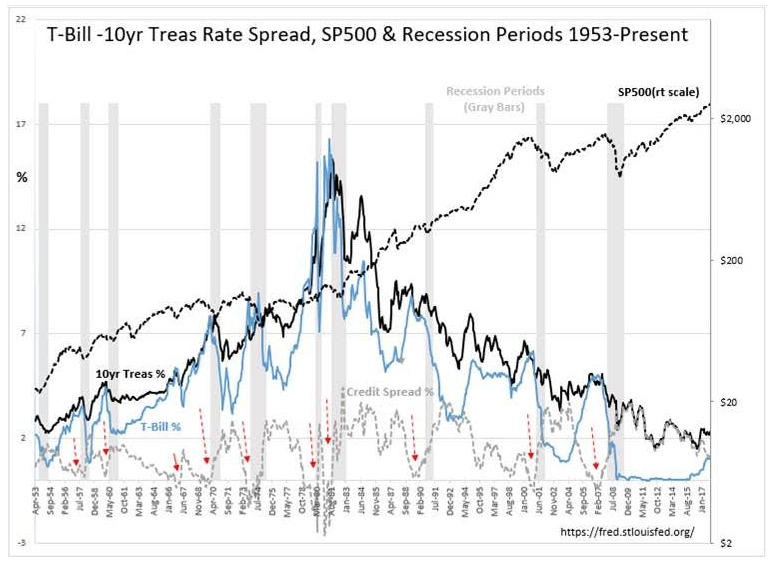
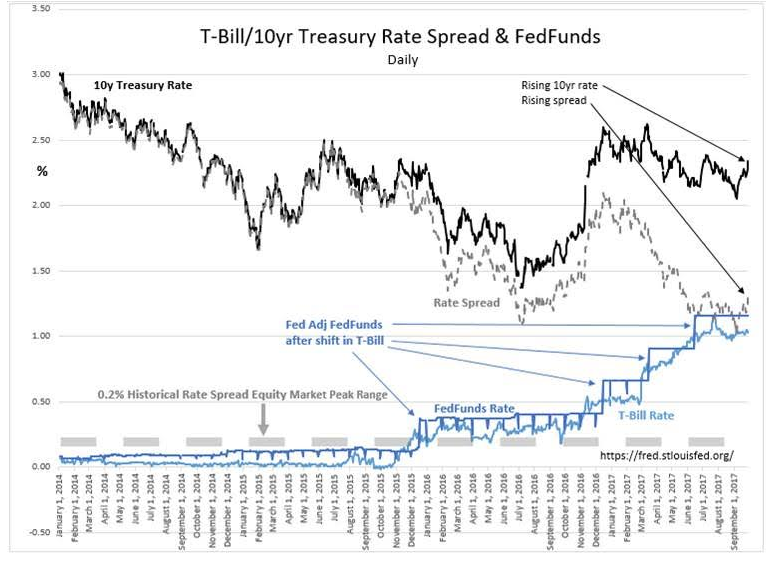
One of the keys to long-term investing on which Wall Street seems to have lost its understanding is the relationship between short-term vs. long-term rates. Even with the many changes which have occurred in banking regulations the past 70yrs, the rate spread between the T-Bill and the 10yr Treasury Note still represents one of the best indicators of future economic activity and the direction of equity prices. The long-term monthly chart presents the relationship to the SP500, the best index for US equities. Regardless of the media focus on one pending collapse or another, the reason why economic activity continues through the many periods of media pessimism typically experienced during a cycle is that the T-Bill/10yr Treasury rate spread remains higher than 0.20% or 20bps(basis points). The T-Bill/10yr Treasury rate spread remains the best proxy for lending profits and lending activity. This holds as true even today as it has been since 1953. It is not whether rates are rising or falling which matters to economic activity. What matters most is this rate spread which determines whether lending activity is likely to be more or less profitable. This spread also provides a measure of investor psychology with the daily chart presenting a dynamic view of current market psychology.
History shows that the widest spread occurs during recessions when investors panic which drives T-Bill rates lower. A spread of 2.25%-2.50% appears typical during recessions since 1970. Lending reaccelarates with spreads at these levels once markets have adjusted to the recession. The spread gradually closes as investors gain confidence and shift capital to higher return investments. The spread is a good indicator of lending activity and market psychology. Equity markets and economic activity continue to rise till investor enthusiasm is so strong that it drives T-Bill/10yr Treasury spread below 0.20%. At that point, additional lending slows which in turn slows the existing economic momentum. Shortly afterwards, the excesses which have entered the economy the past several years begin to emerge. Lending institutions pull back further as defaults build. A recession follows and equity markets experience recessionary correction. The rate spread widens and the cycle has come full circle. The actual direction of rates is not the important indicator. It is the lending spread which is a primary economic indicator. With today’s 1.31% (131bps) spread and rising, rising rates today do not have a negative impact on economic activity as many believe. Rising rates today are a signal that investors are selling Fixed Income for higher returns anticipated elsewhere and turning more optimistic.
From current T-Bill/10yr Treasury rate spread levels, historicaly it has taken 2yrs-3yrs before the 0.20% level has been reached. I suspect it will take a similar time frame before we see 0.20% again. Till then, it is reasonable to expect we are likely to experience an expanding economy and higher equity prices.
Be bullish! The rate spread tells you to be so.
Treasury bills are the shortest-term Treasury issues — they come in three-month and six-month varieties. The fed funds rate, on the other hand, is the rate at which banks lend one another excess reserves — reserves they don’t need to satisfy capital requirements — overnight.Treasury bills are more predictably influenced by the fed funds rate than notes and bonds because Treasury bills and the fed funds rate are competing investments in the money market. The money market is the market for high-quality, short-term debt instruments. Just as individuals put uninvested cash into money market mutual funds, where they can earn interest without putting principal at risk, institutional investors for the same purpose invest directly in the money markets by buying instruments like fed funds and Treasury bills. As investments, fed funds and Treasury bills generally offer comparable yields.
Treasury securities
Investors and those following the movement of interest rates look at the movement of Treasury yields as an indicator of things to come. Their rates are considered an important benchmark: Because Treasury securities are backed by the full faith and credit of the U.S. Treasury, they represent the rate at which investment is considered risk-free.
Click on the links below to find a fuller explanation of the term.
| This week | Month ago | Year ago | |
| One-Year Treasury Constant Maturity | 1.31 | 1.23 | 0.60 |
| 91-day T-bill auction avg disc rate | 1.050 | 1.000 | 0.250 |
| 182-day T-bill auction avg disc rate | 1.170 | 1.115 | 0.420 |
| Two-Year Treasury Constant Maturity | 1.45 | 1.33 | 0.79 |
| Five-Year Treasury Constant Maturity | 1.87 | 1.70 | 1.19 |
| Ten-Year Treasury Constant Maturity | 2.24 | 2.13 | 1.66 |
| One-Year CMT (Monthly) | 1.23 | 1.22 | 0.57 |
| One-Year MTA | 0.944 | 0.889 | 0.523 |
Federal funds rate
In the United States, the federal funds rate is the interest rate at which depository institutions (banks and credit unions) lend reserve balances to other depository institutions overnight, on an uncollateralized basis. Reserve balances are amounts held at the Federal Reserve to maintain depository institutions’ reserve requirements. Institutions with surplus balances in their accounts lend those balances to institutions in need of larger balances. The federal funds rate is an important benchmark in financial markets.[1][2]
The interest rate that the borrowing bank pays to the lending bank to borrow the funds is negotiated between the two banks, and the weighted average of this rate across all such transactions is the federal funds effective rate.
The federal funds target rate is determined by a meeting of the members of the Federal Open Market Committee which normally occurs eight times a year about seven weeks apart. The committee may also hold additional meetings and implement target rate changes outside of its normal schedule.
The Federal Reserve uses open market operations to influence the supply of money in the U.S. economy[3] to make the federal funds effective rate follow the federal funds target rate.
Net interest spread
Net interest spread refers to the difference in borrowing and lending rates of financial institutions (such as banks) in nominal terms. It is considered analogous to the gross margin of non-financial companies.
Net interest spread is expressed as interest yield on earning assets (any asset, such as a loan, that generates interest income) minus interest rates paid on borrowed funds.
Net interest spread is similar to net interest margin; net interest spread expresses the nominal average difference between borrowing and lending rates, without compensating for the fact that the amount of earning assets and borrowed funds may be different.
Example
For example, a bank has average loans to customers of $100, and earns gross interest income of $6. The interest yield is 6/100 = 6%. A bank takes deposits from customers and pays 1% to those customers. The bank lends its customers money at 6%. The bank’s net interest spread is 5%.