
- 02/05/2023 – inflation data
- Inflation rose 6.8% from a year ago in November, slightly higher than estimates according to the consumer price index released Friday.
- Excluding food and energy, the CPI increased 4.9%, in line with expectations.
- Surging prices for food, energy and shelter accounted for much of the gains.
- 11/11/2021 – Tilson thinks bet on inflation might be bad. Because inflation can last very long, and stock price will be elevated at inflation. Either way, bet on int rate might not be a very clean-cut good idea. In addition, we cannot rule out a deflation scenario like German and Japan. Therefore, it might be better to focus on stocks than on interest rate, or I need to trim down my position in TMV and TBT.
The Labor Department announced yesterday that U.S. Inflation Hit 31-Year High in October as Consumer Prices Jump 6.2%. Excerpt:
U.S. inflation hit a three-decade high in October, delivering widespread and sizable price increases to households for everything from groceries to cars due to persistent supply shortages and strong consumer demand.
The Labor Department said the consumer-price index – which measures what consumers pay for goods and services – increased in October by 6.2% from a year ago. That was the fastest 12-month pace since 1990 and the fifth straight month of inflation above 5%.
The core price index, which excludes the often-volatile categories of food and energy, climbed 4.6% in October from a year earlier, higher than September’s 4% rise and the largest increase since 1991.

Based on many articles I’m reading and e-mails I’m receiving, many folks are freaking out about this.
I’m not…
I think it’s a combination of short-term supply chain issues (which will get sorted out), a white-hot economy (which is good for stocks), and U.S. workers demanding and getting higher pay (which is good for America).
Other investors are shrugging this off as well, which is why the S&P 500 Index closed yesterday only 1.2% lower than the all-time closing high it reached on Monday.
If you want to worry about some macro factor, here’s a contrarian view (which I wouldn’t rule out):
|
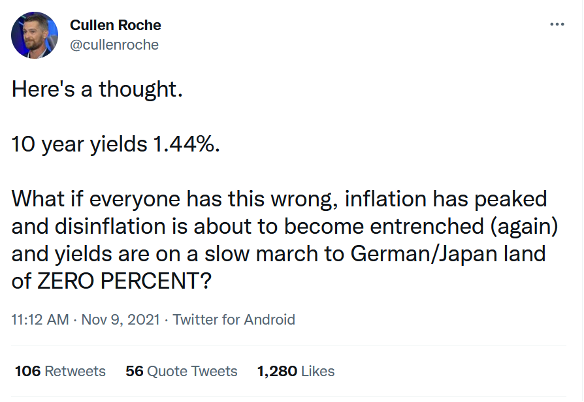
In summary, I spend zero time worrying about inflation (or deflation). If I own good stocks, I’m going to be fine no matter what…
- 11/11/2021 – U.S. consumer prices jump 6.2% in October, the biggest inflation surge in more than 30 years. In addition, reopening components on CPI is smaller now.
- The consumer price index surged 6.2% from a year ago in October, the most since December 1990.
- Core inflation, stripping out food and energy, increased 4.6%, the fastest gain since August 1991.
- Energy, shelter and vehicle costs led the gains, which more than wiped out the wage increases that workers received for the month.
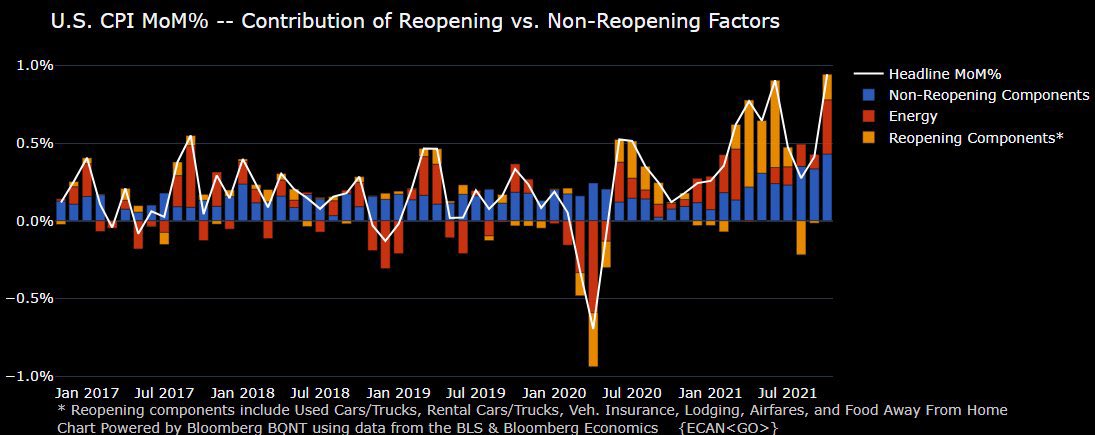
the above graph is from Michael Burry
- 09/27/2021 – So the inflation might not be transitory?
Fed Chair Powell to warn Congress that inflation pressures could last longer than expected
- Fed Chairman Jerome Powell cautioned that the causes of the recent rise in inflation may last longer than anticipated.
- The remarks are part of mandated testimony Powell must give to Congress regarding the Fed’s economic response to the Covid-19 pandemic.
- 09/19/2021 – It seems like Fed is manipulating the data to try to tame down the inflation data
Inflation Is All Over the Place – WSJ
Investors following inflation figures should accept that they can’t extract a reliable signal from the wild swings, and just hope they continue to get lucky
Fed Chairman Jerome Powell said at Jackson Hole last month the Fed was using a measure that strips out extreme price moves to try to get to the true underlying rate. This doesn’t really work, either, as so much depends on the definition of “extreme.”
Mr. Powell used a gauge from the Dallas Fed that throws out the top 31% and bottom 24% of personal consumption expenditure (PCE) price changes, and was bang on the Fed’s 2% year-over-year target in July, the latest available. An alternative measure from the Cleveland Fed strips out the top and bottom 16% of consumer-price index changes, and was far higher; worse, the monthly rate was unchanged in August from July, giving no support to the idea that inflation is already coming back down.
In my view, the market is complacent about the long run, as domestic politics, geopolitics and demographics are all adding inflation pressure, although it is true that technology may continue to be disinflationary.
In the short term, I think the market’s correct: Inflation will probably calm down as supply chains and travel return to normal, but there is a decent chance that it takes much longer than the Fed hopes. A risk also exists that consumers and workers start to think higher inflation is normal, a self-fulfilling prophecy that would push the Fed to tighten policy earlier.
- 09/08/2021 – There might be some difference in the potential upcoming Stagflation than year 1966 through 1982
What Every Investor Should Understand About Stagflation—but Often Doesn’t – WSJ
Many people remember lessons, or think they do, about the 1970s economy. But the comparisons aren’t that simple.
Many investors equate the decade of the 1970s with stagflation, but it is more precisely defined as lasting from 1966 through 1982, according to Edward McQuarrie, a professor at Santa Clara University’s Leavey School of Business who has reconstructed U.S. stock-market history back to 1793. “The mid-1960s are when the inflation that we associate with the 1970s actually began, and the ills we associate with the 1970s didn’t end until 1982,” he says.
Over this 17-year period from 1966 through 1982, inflation was much higher than in the postwar period up until then, and real GDP growth was much smaller. The consumer-price index averaged 6.8% annualized, for example, four times the 1.7% rate over the 1947-1965 period. Real GDP grew at just a 2.2% annualized rate between 1966 and 1982, less than half the 4.5% annualized rate over the 1947-1965 period.
- Bonds: The bond market may be where the greatest misconceptions are centered. Bonds can do this well in a rising-rate environment because of the dynamics of so-called bond ladders—portfolios of bonds with a fixed duration target.
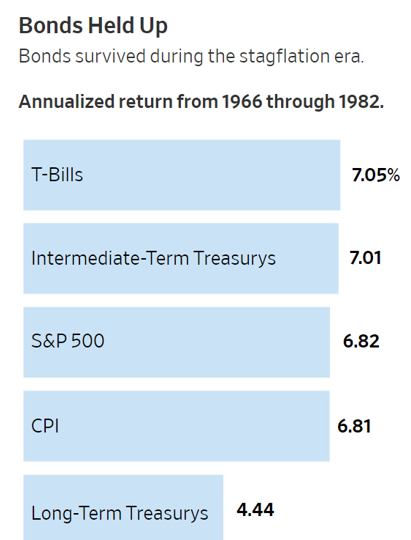
2. Stocks: the S&P 500’s return over this 17-year stretch merely equals inflation and slightly lags behind that of intermediate-term bonds. Prof. McQuarrie says that this period is one of the longest in the U.S. since 1793 “where stocks returned close to nothing in inflation-adjusted terms.”
3. Commodities: according to Campbell Harvey, a finance professor at Duke University, and Claude Erb, a former commodities fund manager at TCW Group, it isn’t clear we should even view commodities as a coherent asset class. We should instead analyze the inflation-hedging potential of each individual commodity on its own. The researchers found that less than half of commodities they studied were significantly correlated with inflation.
- 07/18/2021 – watch out the Fed meeting on July 27-28
Disco Inferno: The U.S. Could Be Headed Back to ’70s-Style Stagflation
Powell had the misfortune to have to defend the central bank’s policies just after much higher-than-expected jumps in consumer and producer prices were reported. The overall consumer price index climbed 0.9% in June, bringing its increase from the level a year earlier to 5.4%, the highest since 2008, when crude oil soared to a record near $150 a barrel, roughly double the current price. The “core CPI,” which excludes food and energy, was up 4.5% year over year, while the producer price index jumped 7.3%. Not counting food and energy, it was up 5.4%. All these figures were vastly above the Fed’s new looser target of somewhat above 2% annual inflation.
The sharp increases revived memories of the bad old days of the 1970s, at least among us oldsters who lived through the then-continuous climb in prices. To be sure, much of the latest pop in the CPI could be traced to anomalous factors related to the reopening of the economy, notably soaring prices for used cars, hotel stays, airfares, and auto rentals. So, a revival of the high inflation of that doleful decade ought to be no more likely that a return of disco.
But the comparisons are blurred by the different yardsticks now in use.
Joseph Carson, former chief economist at AllianceBernstein, points out that the CPI of the 1970s included house prices, while the current index doesn’t. “Here’s a simple illustration of how significant including and not including house price inflation can be. In 1979, the CPI rose 11.3%, and that included a 14% increase in the price of existing homes. In the past 12 months, the CPI has increased 5.4%, and the 23% increase in existing-home prices isn’t part of that. Government statisticians have created an arbitrary owner rent index (up 2.3% in the past year) to replace house prices,” he writes in his Carson Report blog.
In his congressional testimony, Powell said that the Federal Open Market Committee would again discuss the timing for tapering its bond buying at its next meeting, scheduled for July 27-28. The monthly purchases include $40 billion for mortgage-backed securities, something a number of U.S. representatives and senators questioned, given the hot housing market.
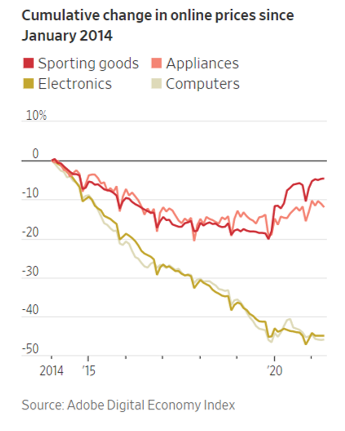
- 07/12/2021 – Inflation Threat May Be Boosted by Changes in Globalization, Demographics and E-Commerce
Inflation Threat May Be Boosted by Changes in Globalization, Demographics and E-Commerce – WSJ
Economists see shifts in these long-term trends putting upward pressure on prices
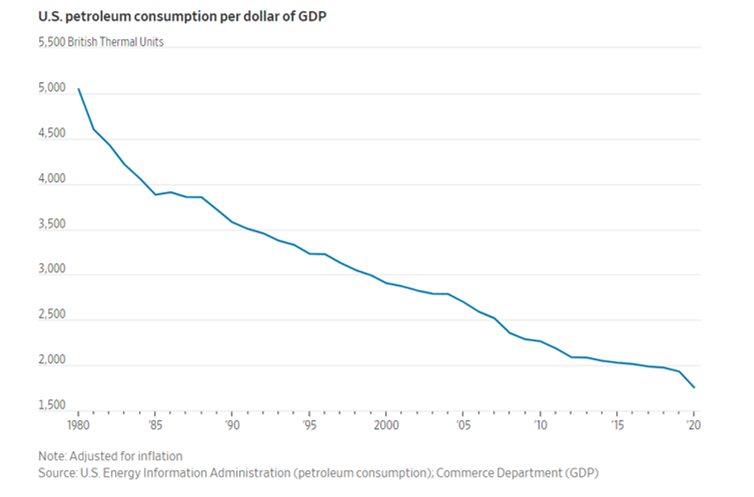
- 07/08/2021 – oil price increase might not cause too much for inflation in US
Why Rising Oil Prices Are Unlikely to Kill the Economic Recovery – WSJ
Crude prices would have to rise higher for longer to significantly brake global growth
One indicator to watch is the oil burden, or the cost of oil as a proportion of gross domestic product, which is a bellwether for oil’s impact on growth. That indicator is expected to rise to 2.8% of global GDP for 2021, assuming an expected average oil price of $75 a barrel this year, according to Morgan Stanley. That, though, remains below the long-term average of 3.2%.
The bank estimates that oil prices would have to average $85 a barrel for the global oil burden to rise to around the long-term average. The last time the global oil burden rose above its long-term average was in 2005, but strong global growth allowed economies to weather the impact of higher oil prices, Morgan Stanley said in a report to clients earlier this year.
The recent rise in prices has been mostly driven by increased demand rather than supply problems, according to the Federal Reserve Bank of New York. Higher prices caused by strong demand rather than supply issues normally indicate resilient growth, economists say.
Moreover, advanced economies are much less vulnerable to oil price increases than decades ago because services, which consume less oil than heavy industry, account for a bigger share of output. In the U.S., it now takes about half as much oil to produce a dollar of gross domestic product as it did 35 years ago, adjusted for inflation, according to data from the Energy Information Administration.
- 07/07/2021 – Brain Wisebury argued that inflation is not transitory
Inflation is not transitory, at least the M2 version is not, supply chain issue may be.
Milton Friedman famously said, “Inflation is always and everywhere a monetary phenomenon in the sense that it is and can be produced only by a more rapid increase in the quantity of money than in output.”
As Milton Friedman famously said, “Inflation is always and everywhere a monetary phenomenon.”
Inflation doesn’t come from higher wages, nor is it driven by deficit spending or above-trend economic growth.
Base effects and supply-chain shortages distort short-term inflation readings, but they don’t impact the amount of money in the system.
It’s the noise in the data that is transitory. Money supply growth – and with it, inflation – is here to stay.
- 06/25/2021 – key inflation indicator posts biggest gain in 3 decades
Key inflation indicator posts biggest year-over-year gain in nearly three decades
- The May core personal consumption expenditures price index, an important inflation gauge for policymakers, rose 3.4% from a year ago, in line with Wall Street estimates.
- That was the biggest increase since 1992 and reflective of ongoing price pressures.
- Consumer spending was flat for the month, missing expectations, while personal income declined 2%, less than the expected 2.7% drop.
The core personal consumption expenditures price index increase reflects the rapid pace of economic expansion and resulting price pressures, and amplified how far the nation has come since the Covid pandemic-induced shutdown of 2020.
The core index rose 0.5% for the month, which actually was below the 0.6% estimate.
Including volatile food and energy prices, the PCE index rose 3.9% for the year and 0.4% for the month.
Most of the inflation increase came from energy, with prices rising 27.4% against just a 0.4% gain in food costs.
Difference between PCE and CPI
Why Two Leading Inflation Gauges Show Different Results – WSJ
The consumer-price index and personal-consumption-expenditures index are both rising this year, but by different degrees
The Commerce Department’s measure of inflation showed Friday that consumer prices rose 3.9% in May from a year before, a big jump but smaller than the 5% jump registered by a Labor Department measure released two weeks ago.
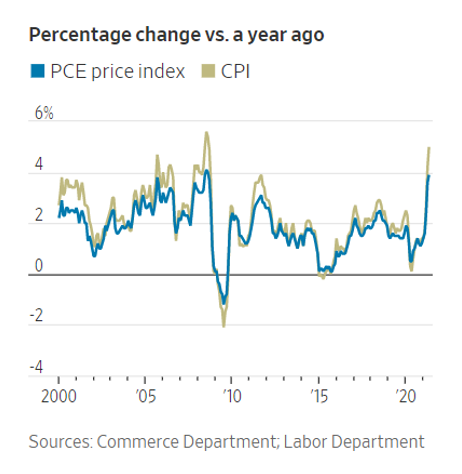
So which is it? Both. Each is an official government consumer inflation gauge, but they are constructed differently and yield different results. Though they tend to move in the same general direction over time, Labor’s consumer-price index, or CPI, typically runs a bit higher than Commerce’s price index of personal-consumption expenditures, or PCE index.
The CPI draws broader attention in general news reports, partly because it is released earlier in the month, but investors and economists also follow the PCE index because it is the Federal Reserve’s preferred gauge for assessing inflation relative to its 2% target.
Here is a brief explanation of some of the variations.
How do the CPI and PCE index differ?
To start, they attempt to measure different universes of spending. The CPI aims to capture changes in the cost of living based on what urban consumers pay out of pocket for a hypothetical basket of goods and services. The PCE index shows a broader basket of price changes, including in rural areas. It also includes prices paid by nonprofit organizations that provide services to households, by government programs such as Medicare and Medicaid and by employer-sponsored health care plans.
The Labor Department each month canvasses 22,000 supermarkets, gasoline stations, department stores and other retail establishments in 75 urban areas. These data flow into hundreds of price indexes for restaurant meals, cars, toys, prescription drugs and countless other products people buy in their daily lives, and those indexes are ultimately aggregated to become the CPI.
The PCE index draws most of its monthly price data from these CPI’s subindexes, but also taps other sources.
The CPI measures price changes for a basket of goods and services that is updated every two years. The PCE index’s formula changes the weights of the items more frequently to account for the substitution effect—for example, if consumers buy fewer apples and more pears when apple prices rise and pear prices don’t.
“That’s one of the reasons why the Fed prefers” the PCE index, said Aneta Markowska, chief financial economist at Jefferies LLC. “It’s a better reflection of reality and how people consume.”
- 06/21/2021 – Biden Administration Outlines Measures to Address Supply-Chain Issues and focus on four areas – semiconductors, used in products from cars to phones; large-capacity batteries used in electric vehicles; pharmaceuticals and rare-earth elements that are key to technology and defense. But it seems like there are so many other areas have the supply crunch problem, how can they resolve it?
Biden Administration Outlines Measures to Address Supply-Chain Issues – WSJ
Action follows 100-day review of the breakdown of supply chains during the pandemic
The Biden administration outlined new measures Tuesday to address widespread supply-chain issues, with a goal of bringing manufacturing back to the U.S. and diversifying access to foreign-made materials such as rare-earth minerals used for batteries.
The steps, which include the creation of a new government supply-chain task force, are the result of a 100-day review that President Biden ordered in February, as the pandemic exposed problems that continue to affect key industries, including auto making.
The review covers four areas: semiconductors, used in products from cars to phones; large-capacity batteries used in electric vehicles; pharmaceuticals and rare-earth elements that are key to technology and defense.
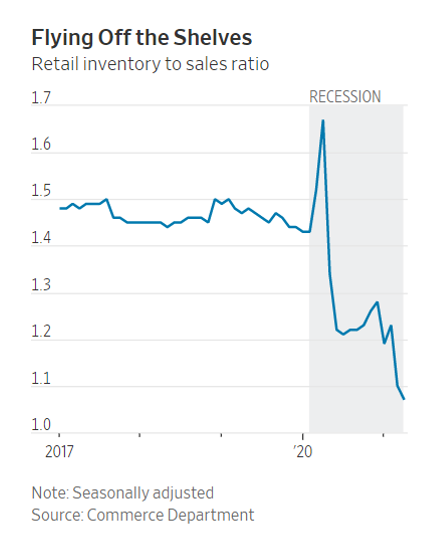
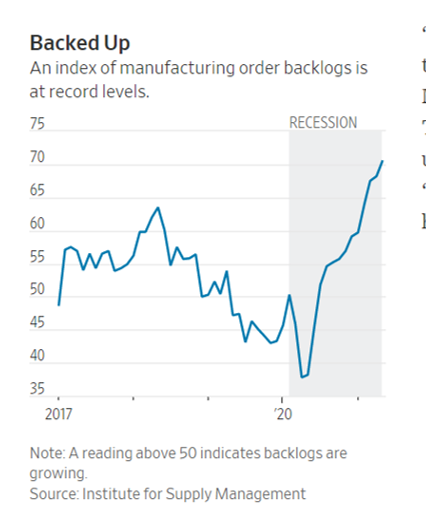
- 06/21/2021 – Supply Crunch Risks Extending Into 2022, Stoking Inflation. Fed officials have said they expect the current mismatch between supply and demand to be temporary. They see inflation receding next year. But if tight inventories and supply shortages extend into 2022—putting more pressure on inflation—officials could find themselves under pressure to change their easy-money policies sooner than planned.
Supply Crunch Risks Extending Into 2022, Stoking Inflation – WSJ
Orders and backlogs have grown while production and hiring slow
Supply constraints that have challenged businesses and caused shortages of everything from semiconductors to sweatpants are deepening, adding to pressure on inflation and testing the Federal Reserve’s resolve to keep juicing the economy.
Economists and business executives now say those supply-chain disruptions, key labor shortages and resurgent demand driven by multiple rounds of fiscal stimulus will persist through the end of the year, if not longer.
Factory activity in the U.S. also has been slow to recover from the pandemic, despite a surge in demand for goods from housebound consumers. Manufacturing output rose 0.9% in May after falling 0.1% in April. Overall industrial output, which also includes mining and utilities, remains 1.4% lower than it was before the pandemic.
“Everything seems in place for factories to ramp up production,” said Jonathan Millar, director of U.S. economics research at Barclays. “It’s kind of been a failure to launch.”
It is a global problem. New Covid-19 outbreaks at a busy Chinese port and in Malaysia and Taiwan have added to shipping delays and worsened an already-dire shortage of computer chips.
“Even in the best case scenario this is not going to be over in less than 12 months,” said Aneta Markowska, chief economist at Jefferies LLC. The crunch could get worse as households gear up for back-to-school shopping, she added. “There’s a very good chance that you’re going to have severe product shortages by September.”
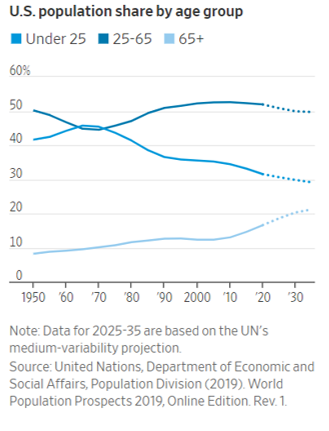
- 06/15/2021 – reasonable counter arguments on 70’s alike stagflation: In recent decades, high public debt vs. GDP has not led to surging inflation; In the early 20th century, inflation was usually associated with wars; Demographics have changed. The demographic wave appears to have crested; Labor market structure is different: Labor compensation is a relatively low share of GDP; Globalization may be slowing, but it hasn’t stopped – all these will possibly damper the inflation
Is 1970s-Style Inflation Coming Back?
In recent decades, high public debt vs. GDP has not led to surging inflation
![Low public debt as a percentage of GDP coincided with core year-over-year inflation that was as high as 10% in the 1970s. However, inflation rates declined in the 1980s, ’90s, and 2000s, to less than 2% despite a high debt-to-GDP ratio.]](https://www.schwab.com/resource-center/insights/sites/g/files/eyrktu156/files/styles/embedded_385/public/Chart%202%20Public%20debt%20as%20a%20percent%20of%20GDP.png?itok=Hu_gupvm)
In the early 20th century, inflation was usually associated with wars

1. Demographics have changed. The demographic wave appears to have crested

2. Labor market structure is different: Labor compensation is a relatively low share of GDP

A second key difference is the structure of the labor market. In the 1970s, workers had much stronger bargaining power than today. Unionization was higher and strikes were more frequent and successful. Union wages tended to keep pace with inflation and even non-union workers were routinely given cost-of-living increases.
Today, unionization is low, limiting the bargaining power of labor. The majority of states are considered “right to work” states, and political pressure to boost wages has diminished. There are plenty of other structural changes that affect wage growth, such as the rise of the service sector, global competition, technological change, and educational gaps. For all these reasons, real wages have not risen much for workers in the bottom half of the income distribution, keeping a lid on aggregate demand relative to supply. It may change going forward given the current focus on income inequality, but today’s starting point is a long way from where things stood in the 1970s.
3. Globalization may be slowing, but it hasn’t stopped.

- 06/14/2021 – JPM is hoarding cash to get ready to invest when market drops due to interest rate hike
Jamie Dimon says JPMorgan is hoarding cash because ‘very good chance’ inflation is here to stay
- JPMorgan Chase has been “effectively stockpiling” cash rather than using it to buy Treasuries or other investments because of the possibility higher inflation will force the Federal Reserve to boost interest rates, Dimon said Monday during a conference.
- “We have a lot of cash and capability and we’re going to be very patient, because I think you have a very good chance inflation will be more than transitory,” said Dimon, the longtime JPMorgan CEO.
- The bank now expects $52.5 billion in net interest income in 2021, down from the $55 billion it disclosed in February, as the firm stockpiled cash and on lower credit-card balances.
“If you look at our balance sheet, we have $500 billion in cash, we’ve actually been effectively stockpiling more and more cash waiting for opportunities to invest at higher rates,” Dimon said. “I do expect to see higher rates and more inflation, and we’re prepared for that.”
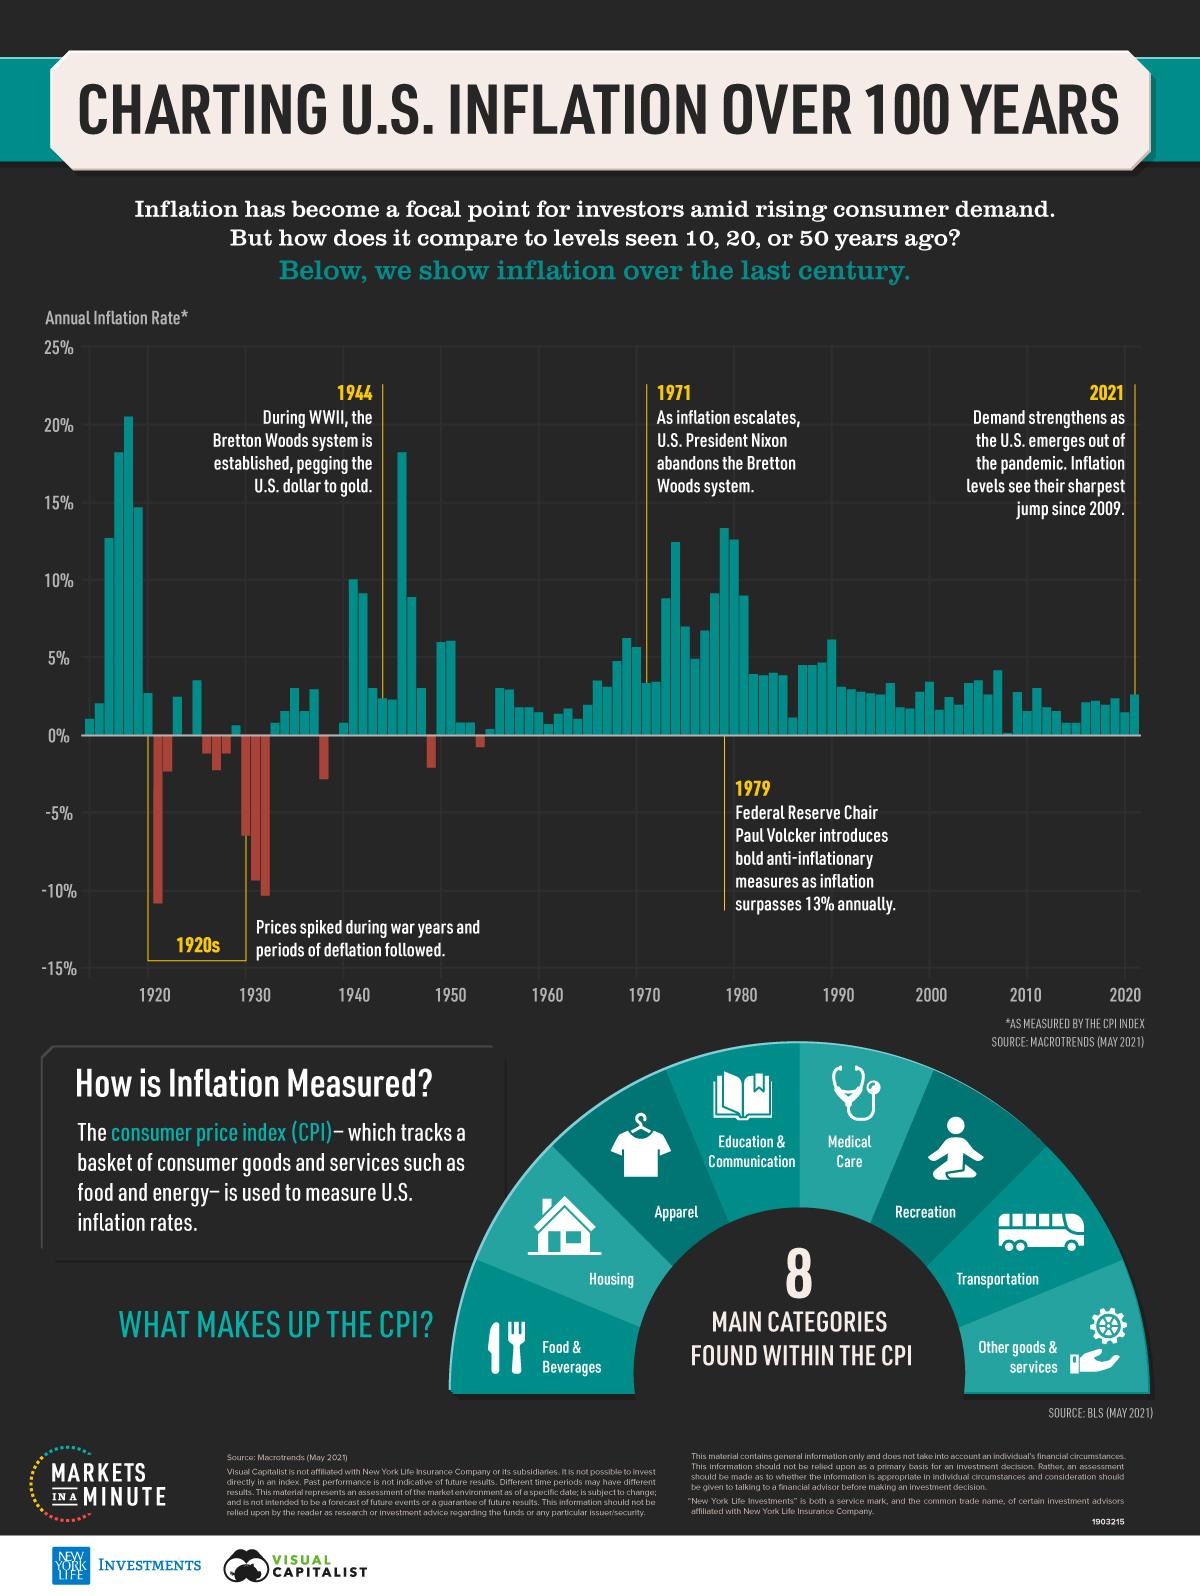
- 06/12/2021 – good to read the history
Visualizing The History Of US Inflation Over 100 Years
- 06/11/2021 – there are some similarities between 1970s’ and nowadays. The run away of inflation is very possible.
- President Lyndon Johnson’s big social program vs. Biden’s
- Vietnam war vs CV-19
- extra int rate
- politician pressure on Fed, Fed not independent
- Fed printed lots of money and very loose policy
- dissimilarity: Rising global competition has left today’s workers with less bargaining power, making it harder for them to demand wage increases in response to inflation. In 1976, six million unionized workers had automatic cost of living adjustments in their contracts. By 1995, the number had dropped to 1.2 million, and such agreements are now rare. Workers thus bear the brunt of inflation, but wage-price spirals seem less threatening. – However, Biden is promoting unions, so will unions get more power?
- dissimilarity: the price of imported goods doubled over the next four years. Moreover, because global trade in many goods was priced in dollars, exporters of commodities like oil also were under pressure. In October 1973, members of the Organization of the Petroleum Exporting Countries, or OPEC, squeezed supplies in an oil embargo targeting the West. It was intended to punish countries that supported Israel but also had the economic aim of pushing up the price of oil as its value in dollars fell. – there is no oil embargo targeting the West nowadays. But if value in dollars fells, OPEC has the incentive to push up the price of oil.
When Americans Took to the Streets Over Inflation – WSJ
In the 1960s and 1970s, spiraling prices for staples like meat and gasoline wreaked havoc on the U.S. economy, thanks to political and policy mistakes that offer a warning for today
The nagging inflation of the late 1960s and 1970s didn’t happen overnight. It took root over years, building through a cascade of policy missteps and misfortunes until it became embedded in the psychology of nearly every American. It would take two deep recessions and new ways of thinking about economics to tame the inflation of that period.
Today’s pickup in consumer prices may not lead to a similar long-term inflation problem. But it might take some political courage from the nation’s central bank and other policy makers to make sure it doesn’t. Preventing the spread of inflation could also involve some economic pain.
Inflation’s Ups and Downs
Consumer Price Index, monthly, percentage change from previous year
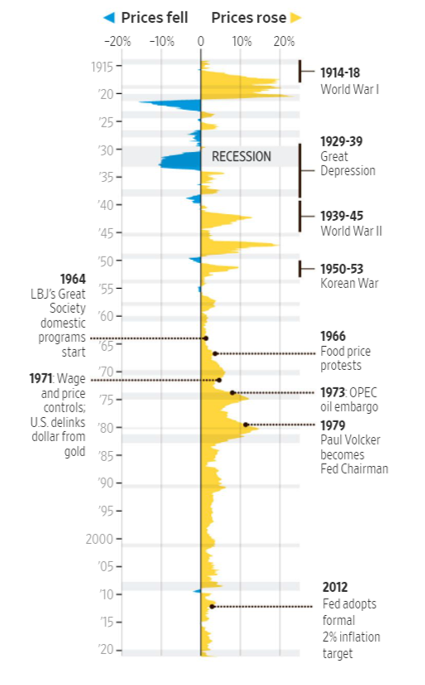
President Johnson and then President Nixon badgered the Fed to keep pumping money into the economy and pushing interest rates lower.
Much of the way that today’s economists think about inflation was shaped by these events. Central bank independence and an official low inflation target became lodestars for central bankers around the world, including the Fed. Economists also came to understand the important role that psychology plays in the monetary affairs of a nation. If consumers, workers and businesses come to believe that inflation will worsen, they will bid up prices and wages in anticipation, fueling the very inflation they loathe. Central bankers now monitor inflation expectations in surveys and financial markets for evidence their credibility is intact.
In recent years, the memory of inflation in the 1970s has worried American policy makers less than the specter of Japan’s slow growth and low inflation in the 2000s. Inflation has run below the Fed’s 2% target consistently since 2008-09, prompting Fed officials to conclude that what the economy really needed was stimulus. Stagnation has been their focus, not stagflation, which is why they have worked so assiduously to keep interest rates low.
Fed officials say recent consumer price increases are transitory, tied to the Covid-19 crisis. Measures of inflation expectations are steady. Mr. Bosworth said he suspects policy makers will ultimately conclude they pumped too much money into the economy in response to the pandemic. Will we see Americans in the streets again protesting out-of-control prices? Not if policy makers heed the lessons of the past.
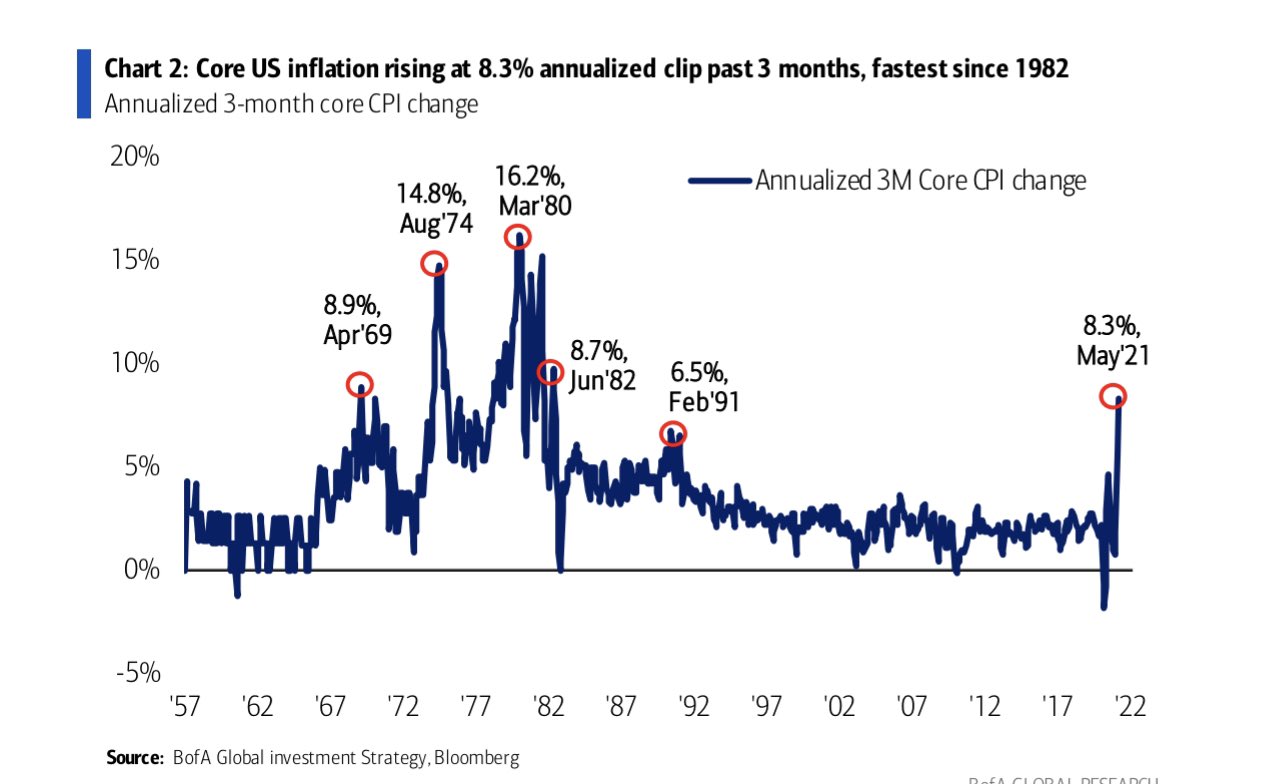
- 06/11/2021 – the nowadays 3 month core CPI is comparable to that of Jun’82, which is stunning. If it stays this high, or even goes higher, for half year. Will we catch the double digit high of 1970’s and 80’s?
- 06/10/2021 – this might be the reason why CPI is up but interest rate is down yesterday and today
Stock Market Today: June 10, 2021
So what drove yesterday’s rotation? The catalyst was the drop in the yield of the 10-year Treasury note, which settled yesterday at 1.489% (it has since rebounded to around 1.53% this morning following the economic data). As noted, this pushed investors into the growth areas, but we don’t think this is a sign that inflation is not an issue. Our sense is it was investors recognizing the underperformance of bonds versus the S&P 500 stocks so far this year and wanting to increase their fixed-income exposure at a rather inexpensive price. It also should be noted that with the sharp run-up in the U.S. stock market since its 2020 coronavirus-driven nadir, many of the pension plans at now fully funded. Plan managers may be seeing an avenue to preserve these gains by adding more fixed-income to their portfolios, which offer more safety than equities, especially with valuations looking quite frothy these days; the S&P 500 Index came within a few points of establishing another record high yesterday.
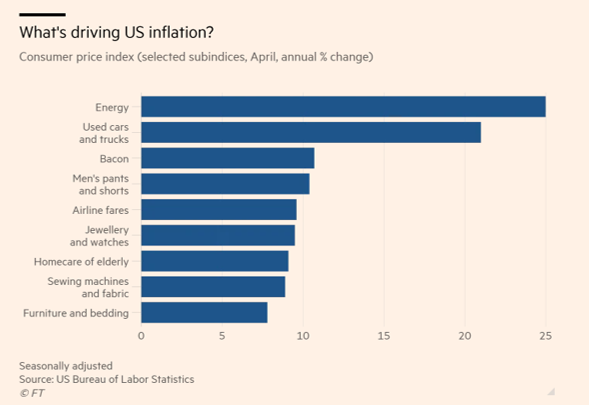
- 06/10/2021 – energy and used car price are the two biggest drivers of inflation. If government can reduce energy price, maybe it will help tame down inflation. In addition, used car price jump may be temporary.
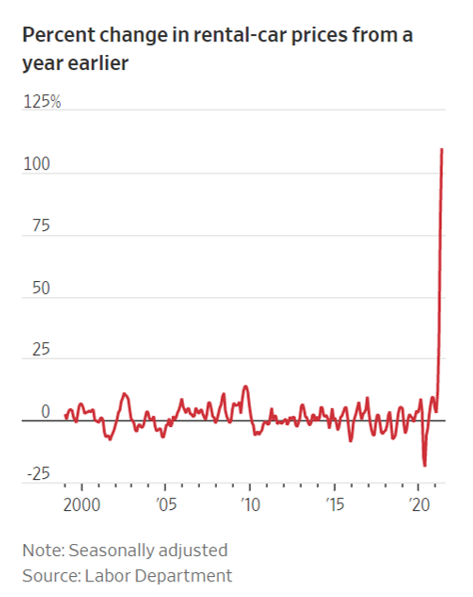
‘Kind of crazy’: how the booming US used-car market is driving inflation
Supply constraints and soaring demand make vehicle prices a key number to watch for the Fed
Unusually, officials are watching used-car prices closely as an indicator for the future path of inflation. If the price rises become entrenched and spread into other parts of the economy, America could face a prolonged period of overheating for the first time in decades, posing a big challenge for the US Federal Reserve and Joe Biden’s economic policymakers.
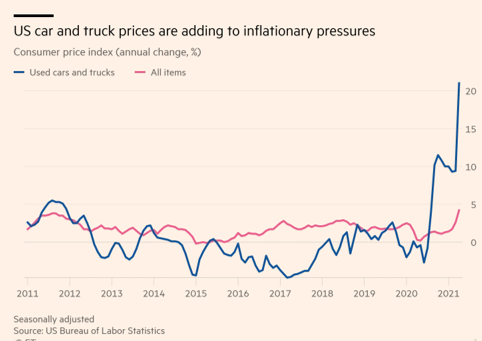
The cost of used cars and trucks jumped 10 per cent month on month in April, and was up 21 per cent compared with a year earlier, making it one of the main drivers of the 4.2 per cent year-on-year surge in the US Bureau of Labor Statistics’ consumer price index. Core inflation, excluding volatile food and energy prices, hit 3 per cent.
Please use the sharing tools found via the share button at the top or side of articles. Copying articles to share with others is a breach of FT.com T&Cs and Copyright Policy. Email licensing@ft.com to buy additional rights. Subscribers may share up to 10 or 20 articles per month using the gift article service. More information can be found here.
https://www.ft.com/content/70491b2f-6b6c-4489-ae14-706ed835c423
“It’s incredibly tight right now: you have more demand . . . that is supported by fiscal stimulus, so it’s just like a perfect storm. And we’re seeing that clearly in prices,” said Laura Rosner, a senior economist at MacroPolicy Perspectives. But Jonathan Smoke of Cox Automotive, a consultancy for car dealers, noted that “several leading indicators of what’s happening at our auctions” suggest “the price appreciation streak is likely going to end”.
“I don’t see a steep drop-off [in prices] until there’s way more supply than there is demand,” he said. “They still have to build the new cars and get the chips in them and get them out. I just think it’s going to last.”
- 06/10/2021 – Question is: is the inflation transitory or lasting? The annual inflation measurements are being boosted by comparisons with figures from last year during pandemic-related lockdowns, when prices plummeted because of collapsing demand for many goods and services. This so-called base effect is expected to push up inflation readings significantly in May and June, dwindling into the fall.Compared with two years ago, overall prices rose a more muted 2.5% in May.
U.S. Inflation Is Highest in 13 Years as Prices Surge 5% – WSJ
The rapid rise in consumer prices in May reflected a surge in demand and shortages of labor and materials
The U.S. economy’s rebound from the pandemic is driving the biggest surge in inflation in nearly 13 years, with consumer prices rising in May by 5% from a year ago.
The Labor Department said last month’s increase in the consumer-price index was the largest since August 2008, when the reading rose 5.4%. The core-price index, which excludes the often-volatile categories of food and energy, jumped 3.8% in May from the year before—the largest increase for that reading since June 1992.
Consumers are seeing higher prices for many of their purchases, particularly big-ticket items such as vehicles. Prices for used cars and trucks leapt 7.3% from the previous month, driving one-third of the rise in the overall index. The indexes for furniture, airline fares and apparel also rose sharply in May.
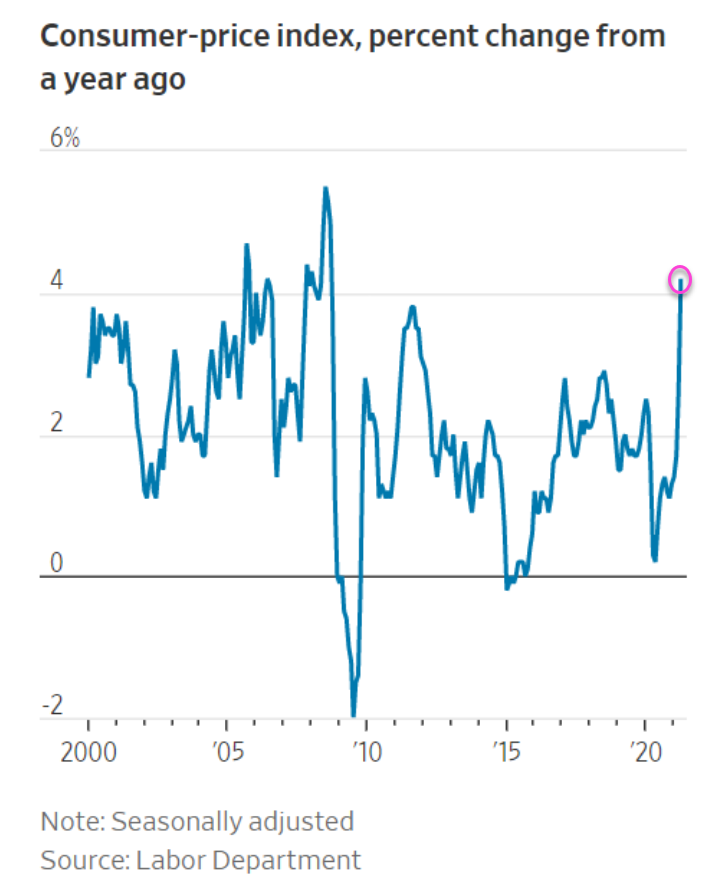
The annual inflation measurements are being boosted by comparisons with figures from last year during pandemic-related lockdowns, when prices plummeted because of collapsing demand for many goods and services. This so-called base effect is expected to push up inflation readings significantly in May and June, dwindling into the fall.
Compared with two years ago, overall prices rose a more muted 2.5% in May.
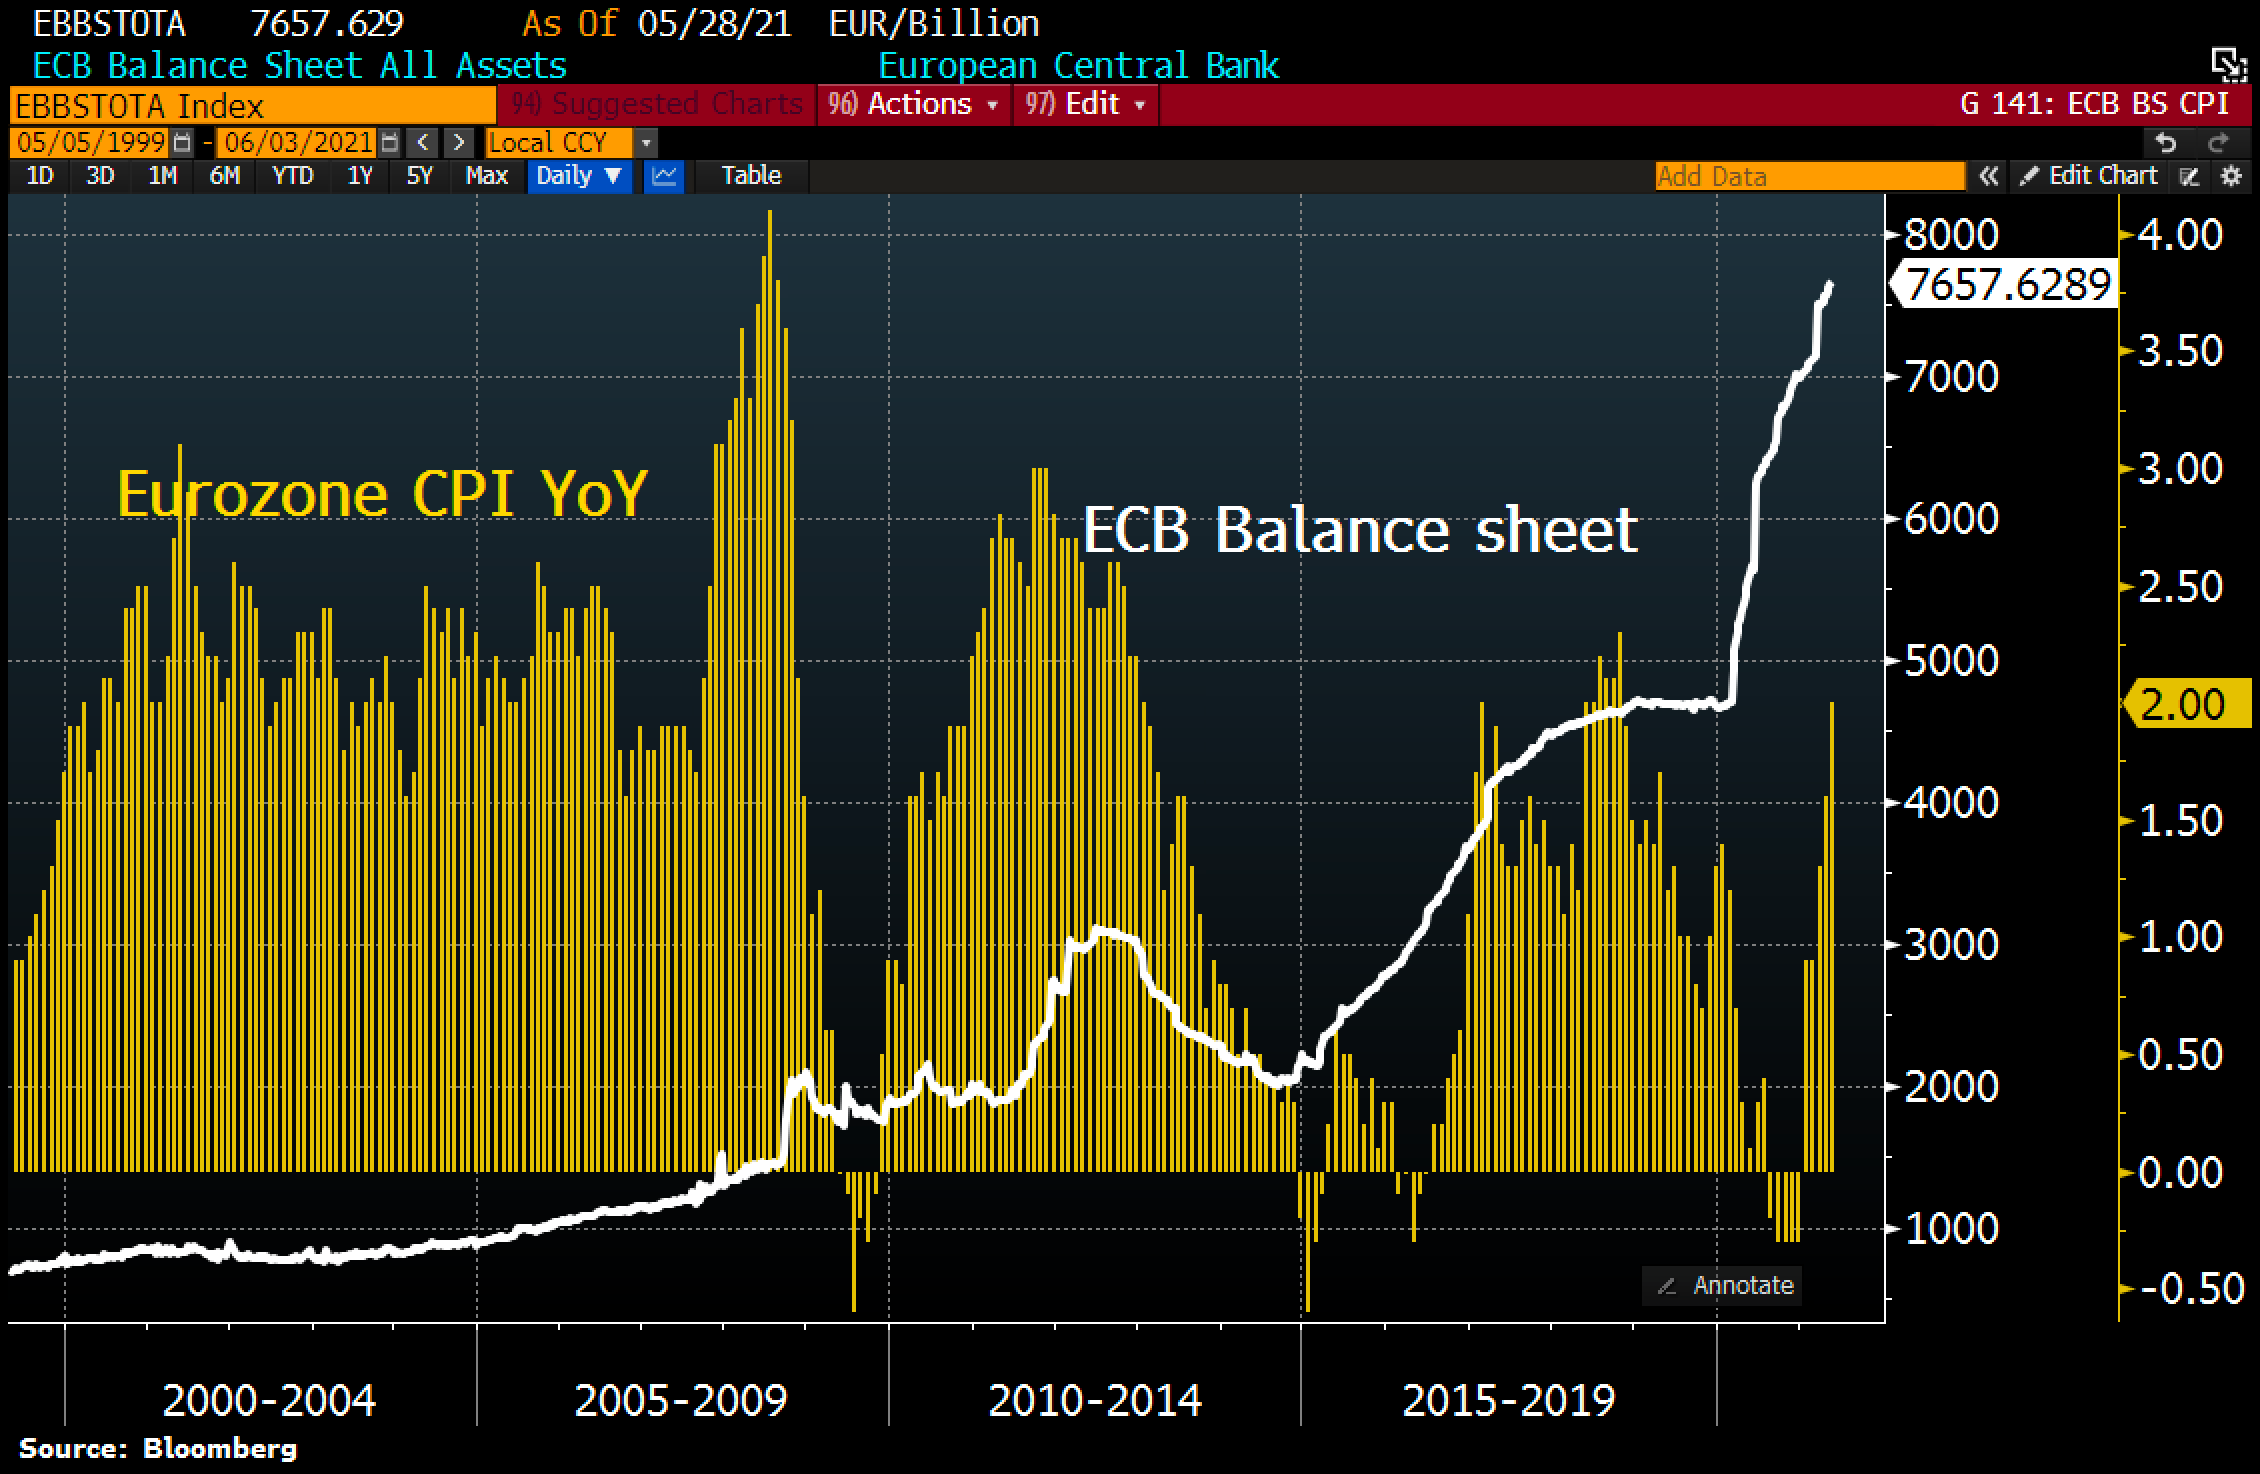
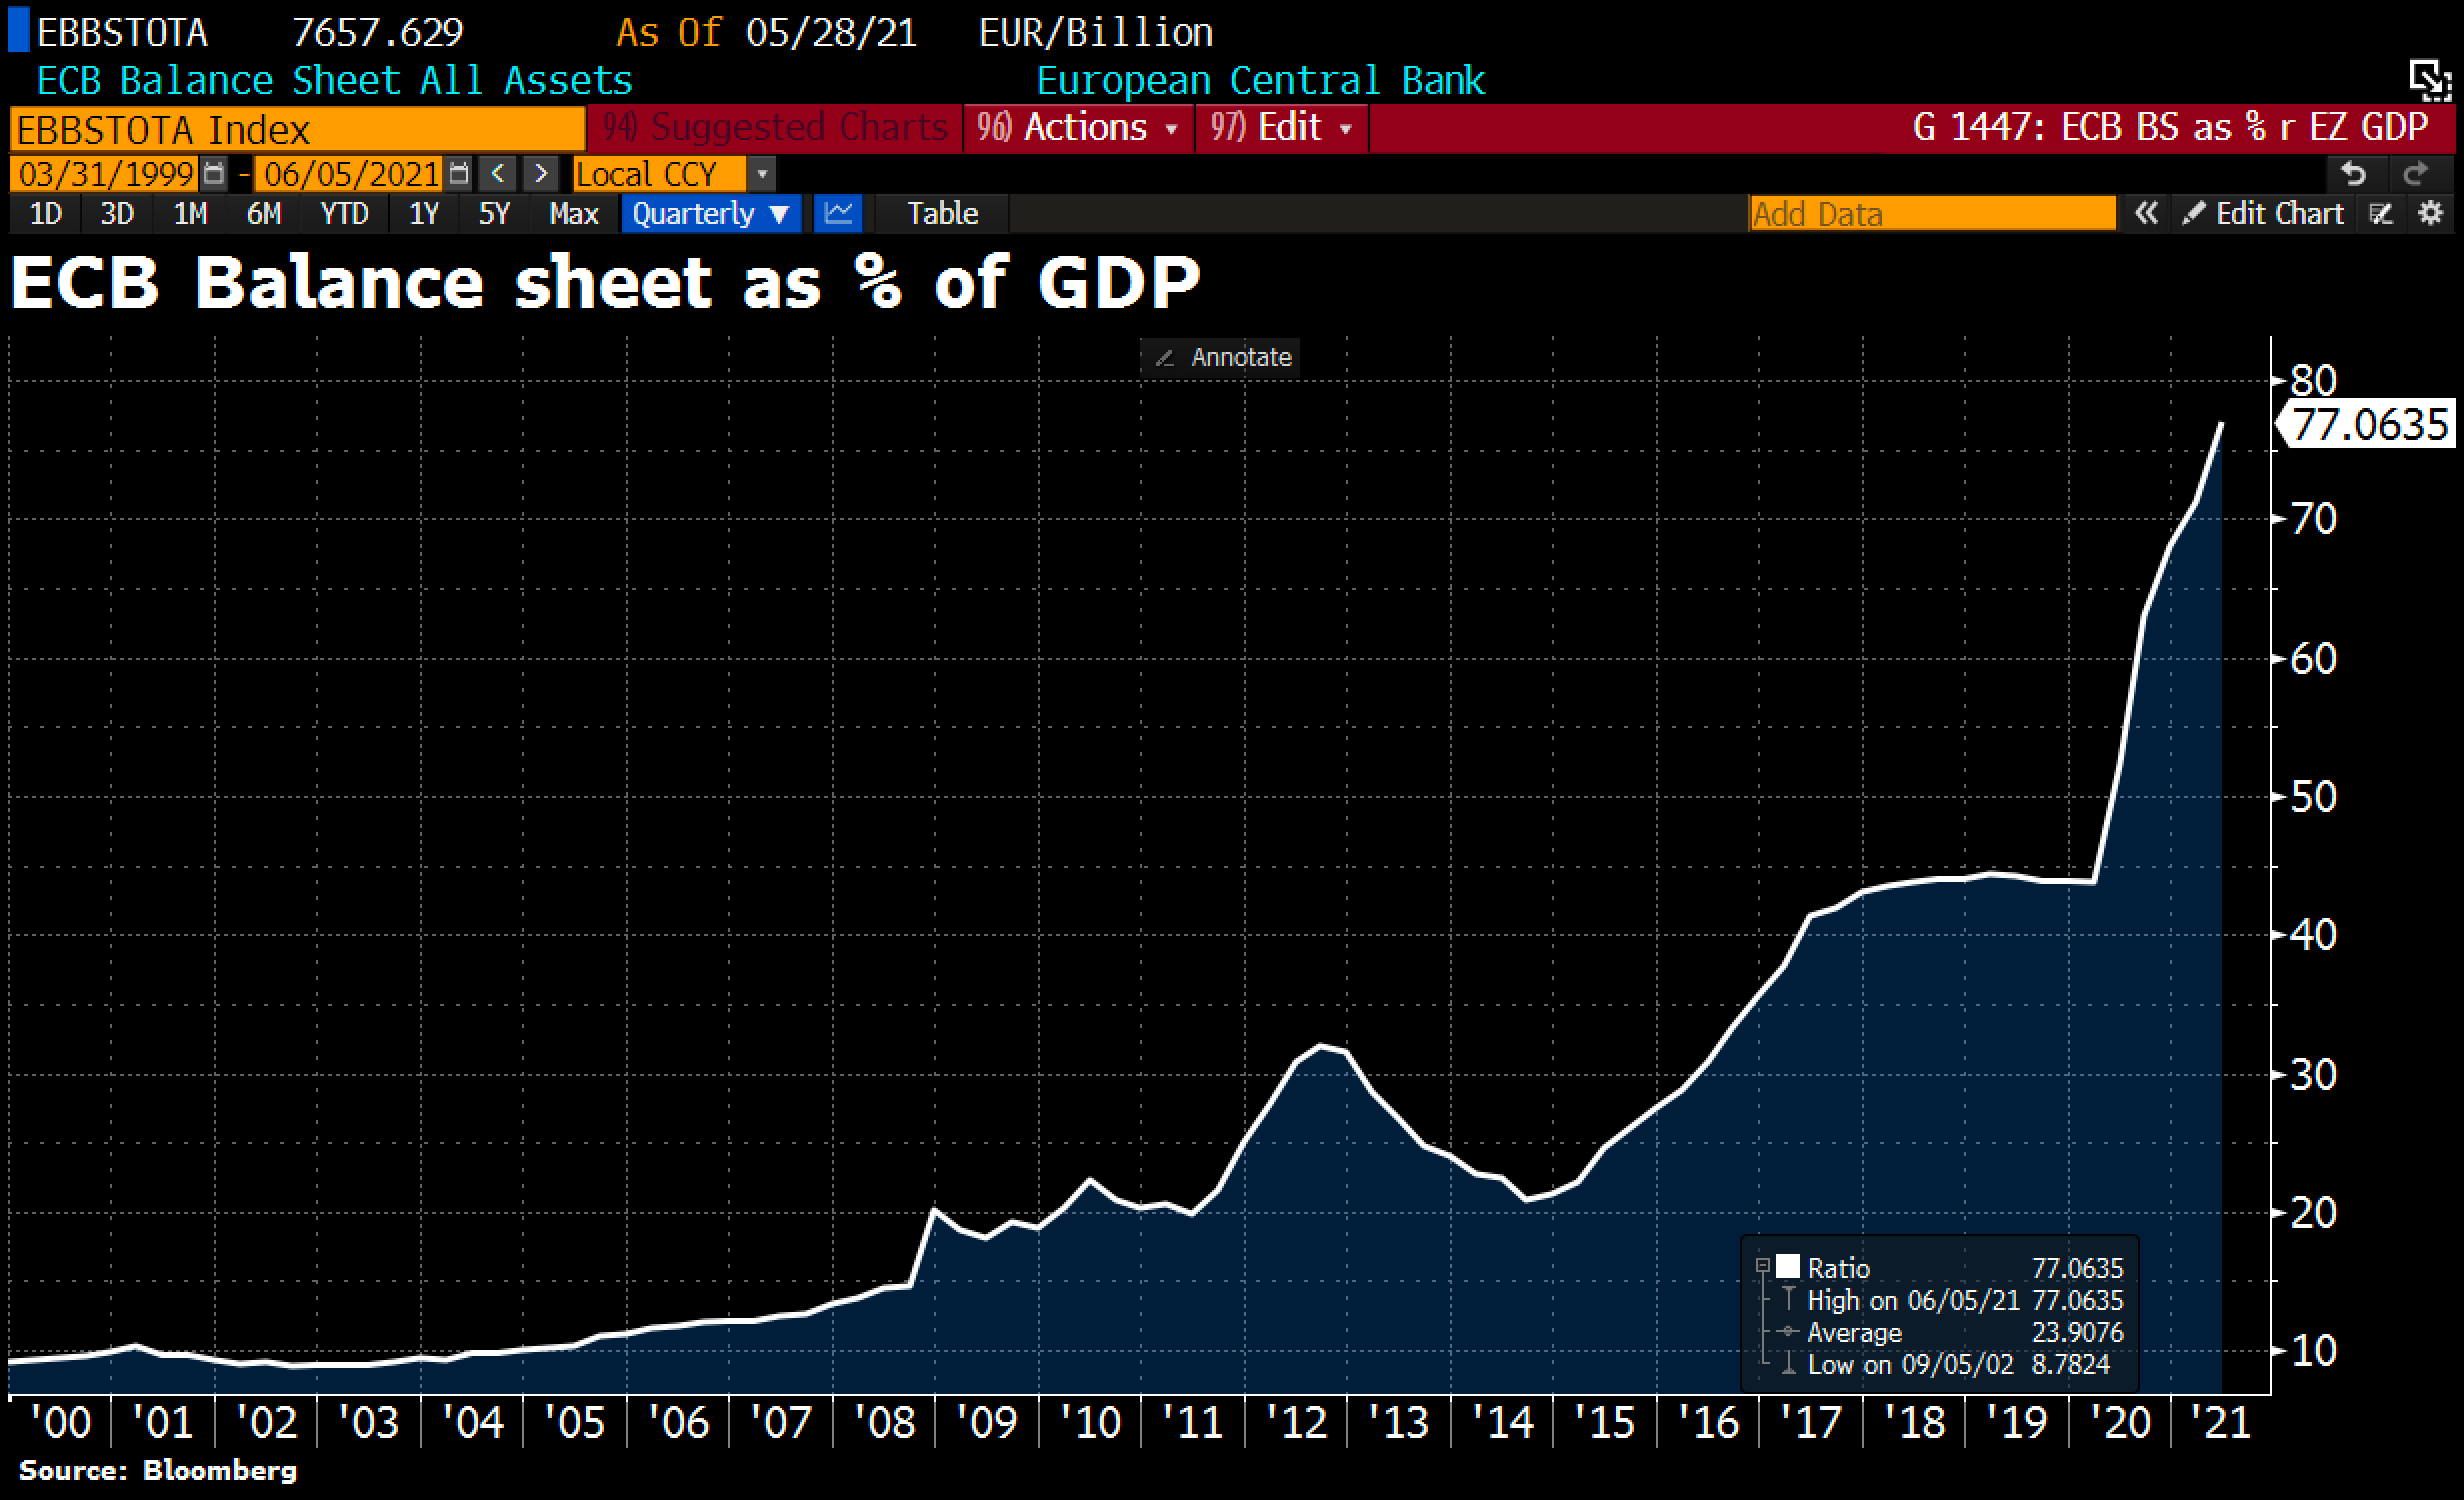
- 06/10/2021 – the inflation pressure on ECB is also mounting.
- 06/10/2021 – Larry Fink said that investors may be underestimating the potential for a spike in inflation. Investors today not used to prolonged inflation, Fink says. If the Fed were to reconsider that, it could seem discordant with separate fiscal stimulus, Fink said. President Joe Biden has proposed additional measures to stimulate the U.S. economy, including a $1.7 trillion infrastructure spending plan. “If our solution is entirely just to get a green world, we’re going to have much higher inflation, because we do not have the technology to do all this, yet,” Fink said. “That’s going to be a big policy issue going forward too: Are we going to be willing to accept more inflation if inflation is to accelerate our green footprint?”
BlackRock CEO Larry Fink Sees Potential for ‘Big Shock’ From Inflation
BlackRock Inc (NYSE:BLK). Chief Executive Officer Larry Fink said that investors may be underestimating the potential for a spike in inflation.
“Most people haven’t had a forty-plus year career, and they’ve only seen declining inflation over the last 30-plus years,” Fink said at a virtual event hosted by Deutsche Bank AG (NYSE:DB) on Wednesday. “So this is going to be a pretty big shock.”
Concern about higher inflation has already seeped into U.S. markets with the cost of goods including lumber and steel rising this year. Fink began his career at First Boston Corp. in 1976, in a period of elevated inflation. The U.S. Consumer Price Index touched a high of 14.8% in March 1980.
If the Fed were to reconsider that, it could seem discordant with separate fiscal stimulus, Fink said. President Joe Biden has proposed additional measures to stimulate the U.S. economy, including a $1.7 trillion infrastructure spending plan.
“That would be pretty odd, raising interest rates at the same time we do this giant fiscal stimulus,” Fink said.
Prices may also rise as companies adapt to the realities of climate change, he said. New York-based BlackRock has advocated for companies disclosing how they plan to adapt to a net zero greenhouse gas emissions economy by 2050.
“If our solution is entirely just to get a green world, we’re going to have much higher inflation, because we do not have the technology to do all this, yet,” Fink said. “That’s going to be a big policy issue going forward too: Are we going to be willing to accept more inflation if inflation is to accelerate our green footprint?”

- 06/10/2021- there is a big dislocation between CPI and 10 year Treasury note yield. Are investors/institutional are buying treasury for safety concern? or, investors think the inflation is ONLY transitory? We will see.
- 06/10/2021 – great to learn the history of 1970s stagflation
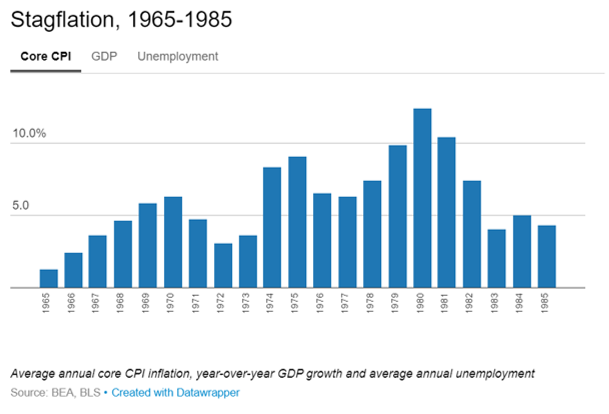
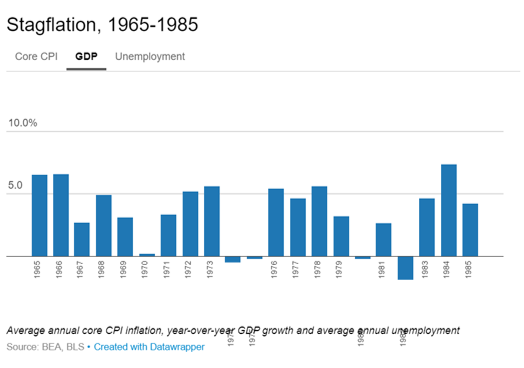
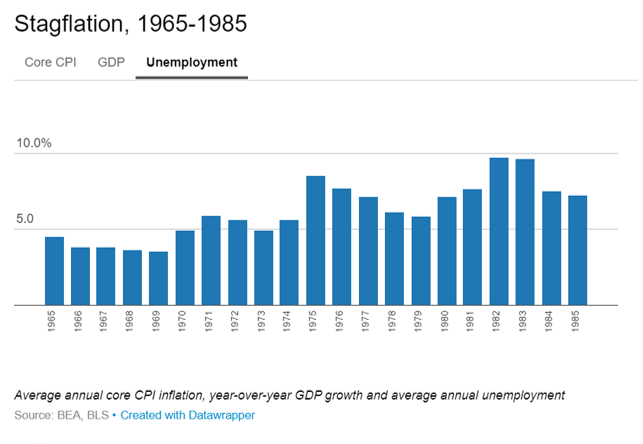
Stagflation in the 1970s – great illustration of history of stagflation
1970s Economy: When people think of the U.S. economy in the 1970s, many things come to mind:
- High oil prices
- Inflation
- Unemployment
- Recession
In November 1979, the price per barrel of West Texas Intermediate crude oil surpassed $100 (in 2019 dollars) and peaked at $125 the following April (see chart below). That price level would not be exceeded for 28 years.
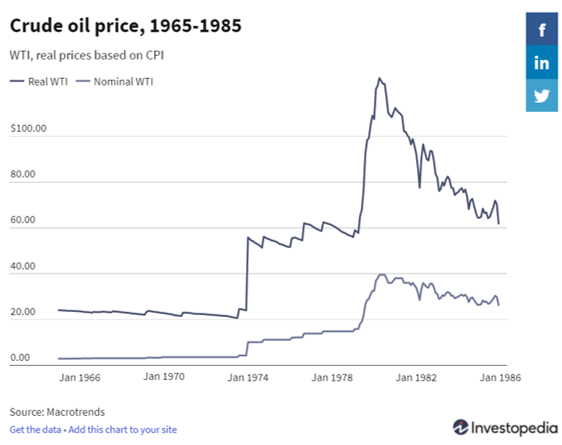
Indeed, inflation was high by U.S. historical standards: core consumer price index (CPI) inflation—that is, excluding food and fuel—reached an annual average of 13.5% in 1980.2 Unemployment was also high,3 and growth uneven; the economy was in recession from December 1969 to November 1970, and again from November 1973 to March 1975.4.
In a 2003 speech, Ben Bernanke said about the 1970s, “the Fed’s credibility as an inflation fighter was lost and inflation expectations began to rise.”10 The Fed’s loss of credibility significantly increased the cost of achieving disinflation. The severity of the 1981-82 recession, the worst of the postwar period, clearly illustrates the danger of letting inflation get out of control.
This recession was so exceptionally deep precisely because of the monetary policies of the preceding 15 years, which had unanchored inflation expectations and squandered the Fed’s credibility. Because inflation and inflation expectations remained stubbornly high when the Fed tightened, the impact of rising interest rates was felt primarily on output and employment rather than on prices, which continued to rise.
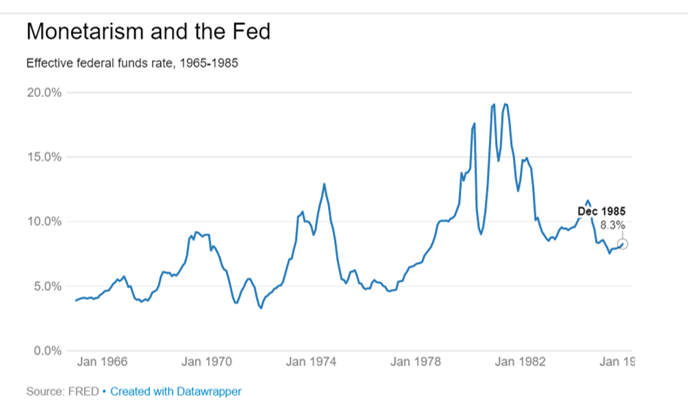
- 06/10/2021 – Very helpful to relearn the history of Volcker’s handling of Great Inflation. The current economic condition is quite resemble to that of 1970’s: During the 1960s and early 1970s, various Fed chairmen made rumblings about fighting inflation, but they always backed down when the complaints about the resulting higher cost of credit grew loud. Fed Chairman William McChesney Martin, for example, was no match for President Lyndon Johnson, who depended on cheap credit to finance the Vietnam War and his Great Society.
President’s Message: Volcker’s Handling of the Great Inflation Taught Us Much
On Oct. 6, 1979, Fed Chairman Paul Volcker took dramatic steps to rein in the runaway inflation that had been sapping the strength of our economy since the mid-1960s. Without his bold change in monetary policy and his determination to stick with it through several painful years, the U.S. economy would have continued its downward spiral. By reversing the misguided policies of his predecessors, Volcker set the table for the long economic expansions of the 1980s and 1990s.
How bad was the period of the Great Inflation? The inflation rate, a mere 1 percent in 1965, hit 14 percent by 1980. Unemployment trended up from a low of 3.5 percent (annual average) in 1969 to 9.7 percent in 1982. The stock market was in the dumps. Oil prices jumped off the charts. Presidents Richard Nixon and Jimmy Carter became desperate enough to tinker with price controls, the results being disastrous.
Volcker, in office only two months, took the radical step of switching Fed policy from targeting interest rates to targeting the money supply. The days of “easy credit” turned into the days of “very expensive credit.” The prime lending rate exceeded 21 percent. Unemployment reached double digits in some months. The dollar depreciated significantly in world foreign exchange markets. Volcker’s tough medicine led to not one, but two, recessions before prices finally stabilized.
The Fed also learned that to be effective, it must have the confidence of the markets and the public. During the 1960s and early 1970s, various Fed chairmen made rumblings about fighting inflation, but they always backed down when the complaints about the resulting higher cost of credit grew loud. Fed Chairman William McChesney Martin, for example, was no match for President Lyndon Johnson, who depended on cheap credit to finance the Vietnam War and his Great Society. Because the markets observed the Fed’s lack of fortitude, they had no expectations that the Fed would conquer inflation. It is extremely costly to bring inflation down if inflation expectations don’t come down. Not until Volcker showed that the Fed could take the heat did the markets believe that the Fed was serious this time.
Another lesson from the Great Inflation is that the Fed can only achieve its goal of maximum sustainable employment if it is successful in achieving its goal of price stability. The idea that we can let down our guard on inflation to increase employment is unwise in the long term because higher inflation eventually destroys rather than creates jobs.
- 06/07/2021 – study the history
https://www.thoughtco.com/stagflation-in-a-historical-context-1148155
https://www.thebalance.com/what-is-stagflation-3305964
- 06/07/2021 – The Deutsche team said the coming inflation could resemble the 1970s experience, a decade during which inflation averaged nearly 7% and was well into double digits at various times. Soaring food and energy prices along with the end of price controls helped push that era’s soaring inflation.“Already, many sources of rising prices are filtering through into the US economy. Even if they are transitory on paper, they may feed into expectations just as they did in the 1970s,” they said. “The risk then, is that even if they are only embedded for a few months they may be difficult to contain, especially with stimulus so high.”
Deutsche Bank warns of global ‘time bomb’ coming due to rising inflation
- In an out-of-consensus forecast, Deutsche Bank is warning of a potential crisis coming from inflation.
- “The effects could be devastating, particularly for the most vulnerable in society,” the firm’s economists said.
- Most on Wall Street and at the Fed see inflation is a temporary problem that will ebb as special factors fade away.
Inflation may look like a problem that will go away, but is more likely to persist and lead to a crisis in the years ahead, according to a warning from Deutsche Bank economists.
In a forecast that is well outside the consensus from policymakers and Wall Street, Deutsche issued a dire warning that focusing on stimulus while dismissing inflation fears will prove to be a mistake if not in the near term then in 2023 and beyond.
“Never before have we seen such coordinated expansionary fiscal and monetary policy. This will continue as output moves above potential,” Folkers-Landau said. “This is why this time is different for inflation.”
The Deutsche team said the coming inflation could resemble the 1970s experience, a decade during which inflation averaged nearly 7% and was well into double digits at various times. Soaring food and energy prices along with the end of price controls helped push that era’s soaring inflation.
Then-Fed Chairman Paul Volcker led the effort to squash inflation then, but needed to use dramatic interest rate hikes that triggered a recession. The Deutsche team worries that such a scenario could play out again.
“Already, many sources of rising prices are filtering through into the US economy. Even if they are transitory on paper, they may feed into expectations just as they did in the 1970s,” they said. “The risk then, is that even if they are only embedded for a few months they may be difficult to contain, especially with stimulus so high.”
The firm said interest rate hikes could “cause havoc in a debt-heavy world,” with financial crises likely particularly in emerging economies where growth won’t be able to overcome higher financing costs.
Segment 207: Stagflation in the 1970s
- 06/07/2021 – Possible Taper timeline: June/July: Fed discusses taperSept/Nov. Fed announces taper Dec/Jan: Fed begins to taper. The key risk now is that the Fed, in trying to avoid a taper tantrum, maintains easy monetary policy too long, allowing inflation to become a permanent, rather than temporary, problem.
The Fed is in early stages of a campaign to prepare markets for tapering its asset purchases
- Comments by Fed officials in the past several weeks suggest the issue of tapering looks likely to be discussed as soon as next week’s FOMC meeting.
- While the discussion may take place, an announcement of a decision to actually taper would be several months later, perhaps in late summer or early fall.
- The Fed may be on track to then begin asset purchase reductions later this year or early next year.
- Behind the glacial pace of reducing asset purchases is a deliberate attempt to avoid another “taper tantrum,” the sharp spike in bond yields seen in 2013.
Comments by Fed officials in the past several weeks suggest the issue of tapering looks likely to be discussed as soon as the Federal Open Markets Committee meeting next week, and the Fed may be on track to begin asset reductions later this year or early next year.
At least five Fed officials have publicly commented on the likelihood of those discussions in recent weeks, including Patrick Harker, president of the of the Federal Reserve Bank of Philadelphia, Robert Kaplan of Dallas, Fed Vice Chair for bank supervision Randal Quarles and Cleveland Fed President Loretta Mester, whose comments to CNBC came after Friday’s monthly jobs report.
“As the economy continues to improve, and we see it in the data, and we get closer to our goals … we’re going to have discussions about our stance of policy overall, including our asset purchase programs and including our interest rates,” Mester said Friday.
Possible Taper timeline:
- June/July: Fed discusses taper
- Sept/Nov. Fed announces taper
- Dec/Jan: Fed begins to taper
The key risk now is that the Fed, in trying to avoid a taper tantrum, maintains easy monetary policy too long, allowing inflation to become a permanent, rather than temporary, problem.
- 06/07/2021 – No other major central bank has adopted anything like the Fed’s new framework. I expect other Group of 20 central banks to move further from the Fed’s policy in the coming months. The international pressure is on for Fed. If the Fed doesn’t begin action imminently, it may be too late. Others will fund the nation’s profligacy even after economic growth slows and the debt burden grows.
The Fed’s Risky Fill-the-Punch-Bowl Strategy – WSJ Growth is surging, the housing market is hot, and inflation is on the rise. It’s time to pull back.
My mentor, the late George Shultz, would often say “an economist’s lag is a politician’s nightmare.” Changes in economic policy take several quarters to affect the real economy. Politicians usually aren’t that patient.
The Federal Reserve announced a new policy doctrine almost a year ago. In essence, the Fed said it would no longer consider lags when making monetary policy, forsaking the policy of “pre-emption” that was standard under Fed heads Paul Volcker, Alan Greenspan, Ben Bernanke and Janet Yellen. Jerome Powell’s Fed believes the party is just getting started and won’t remove the punch bowl until the fun is in full swing and the neighbors know it. Most in Washington can barely contain their enthusiasm for the new doctrine. Wall Street loves it too.
Optimism about the future, however, should be matched by memories of the past. Real economic growth is surging more than it did during the Reagan years. U.S. government spending is growing at the fastest clip since World War II. The housing market is running hotter than it did in the runup to 2008. Financial-market ebullience is stronger and broader than during the dot-com boom at the turn of the century. And economic output will shortly surpass historic highs.
The Fed might be right. The surge in prices and wages might be transitory. The widespread anecdotes of worker shortages and significant wage increases might not constitute a sustainable trend. Inflation expectations might be stable. Count me skeptical of the Fed’s convictions. The risks the Fed is taking with its winsome forecast are significant, and the consequences of policy error are severe.
The reanchoring of expectations—a little higher but not too much—is a far tougher task, especially amid the shifting seas of the post-pandemic economic resurgence.
No other major central bank has adopted anything like the Fed’s new framework. The People’s Bank of China has already removed significant accommodation. The Bank of Canada announced meaningful steps toward normalization. The Bank of Korea signaled interest in somewhat tighter policy. I expect other Group of 20 central banks to move further from the Fed’s policy in the coming months.
Inflation is scarcely the sole or predominant policy risk. The scale of government spending and scope of government activity are unprecedented. Since the onset of the pandemic last February, the Fed has bought 56% of total Treasury issuance of $4.5 trillion. The Fed’s asset purchases represent 76% of the cumulative federal fiscal deficit. And the Biden administration is proposing a $6 trillion budget for fiscal 2022, about a third of which would be unfunded.
The Fed says it’s still too early to slow its purchases of Treasurys and agency-backed housing debt. If the Fed doesn’t begin action imminently, it may be too late. Others will fund the nation’s profligacy even after economic growth slows and the debt burden grows. But what interest rate investors will demand for the privilege?
- 06/05/2021 –
With inflation near a 20-year high, here are the stronger sectors: Alpha Tactics
The Inflation Scare Is Temporary: The Fed Should Not Yet Raise Interest Rates
The global chip shortage could last until 2023
- 06/05/2021 – Just-in-time (and therefore almost no inventory) might cause the cascade of shortage on everything. How long will it take to fix this disruption of supply chain? It might take years. supplies shortages + economy reopening + extra low interest rate + excess stimulus plan might cause a perfect storm for hyper inflation.
How the World Ran Out of Everything
Global shortages of many goods reflect the disruption of the pandemic combined with decades of companies limiting their inventories.
In the story of how the modern world was constructed, Toyota stands out as the mastermind of a monumental advance in industrial efficiency. The Japanese automaker pioneered so-called Just In Time manufacturing, in which parts are delivered to factories right as they are required, minimizing the need to stockpile them.
Over the last half-century, this approach has captivated global business in industries far beyond autos. From fashion to food processing to pharmaceuticals, companies have embraced Just In Time to stay nimble, allowing them to adapt to changing market demands, while cutting costs.
But the tumultuous events of the past year have challenged the merits of paring inventories, while reinvigorating concerns that some industries have gone too far, leaving them vulnerable to disruption. As the pandemic has hampered factory operations and sown chaos in global shipping, many economies around the world have been bedeviled by shortages of a vast range of goods — from electronics to lumber to clothing.
In a time of extraordinary upheaval in the global economy, Just In Time is running late.
“It’s sort of like supply chain run amok,”
From 1981 to 2000, American companies reduced their inventories by an average of 2 percent a year, according to one study. These savings helped finance another shareholder-enriching trend — the growth of share buybacks.
In 1999, an earthquake shook Taiwan, shutting down computer chip manufacturing. The earthquake and tsunami that shattered Japan in 2011 shut down factories and impeded shipping, generating shortages of auto parts and computer chips. Floods in Thailand the same year decimated production of computer hard drives.
Why There are Now So Many Shortages
supplies shortages + economy reopening + extra low interest rate + excess stimulus plan might cause a perfect storm for hyper inflation.
- 06/03/2021 – tide of inflation is coming in SK
South Korea’s inflation hits 9-year high as commodity prices jump
- South Korea’s consumer inflation accelerated to a more than nine-year high in May, reinforcing calls for gradual monetary tightening, though the increase was mainly due to a low base effect and rises in oil and agricultural prices.
- Consumer prices rose 2.6% in May from a year earlier, government data showed on Wednesday, logging the fastest growth since April 2012 and matching a median estimate for a 2.6% increase in a Reuters survey. It grew 2.3% in April.
- In May 2020, South Korea fell into deflation as the coronavirus pandemic struck demand and supply chains.
- 06/02/2021 – if supply comes back fast, the inflation may become temporary. In the 1970s, strong labor unions secured pay rises that matched rising inflation, and businesses then raised their prices to maintain their profit margins, provoking a fresh round of wage demands. “Many people are making the comparison with the 1970s, but the world is very different,” said Laurence Boone, the OECD’s chief economist. “We’re more open, we don’t have the same level of unionization and indexation, and the demographics are different.” – I need to study history of 1970’s
Inflation in Rich Countries Hit a 12-Year High in April – WSJ
Jump in oil prices has led some to see echoes of the 1970s, but increase in supply suggests pressures will be temporary
The Organization for Economic Cooperation and Development Wednesday said consumer prices in its 36 members, which are mostly rich countries, were 3.3% higher than in April 2020. That was the largest increase since October 2008.
Across the Group of 20 leading economies, which account for about four-fifths of global economic activity, the annual rate of inflation rose to 3.8% from 3.1% in March, reaching its highest level in over a year.
Economists mostly think the risk of a repeat is very low, citing the many ways in which the global economy has changed over the past half-century. In the 1970s, strong labor unions secured pay rises that matched rising inflation, and businesses then raised their prices to maintain their profit margins, provoking a fresh round of wage demands.
“Many people are making the comparison with the 1970s, but the world is very different,” said Laurence Boone, the OECD’s chief economist. “We’re more open, we don’t have the same level of unionization and indexation, and the demographics are different.”
- 05/26/2021 – “If that money is wasted, it is not productively spent, we will have more inflation, less productivity, slower growth and the American democracy you will have lost even more credibility eyes in the world,” Dimon said.
White House sticks by Biden’s $4T spending plans despite Dimon warning on inflation
Congress has already approved about $6 trillion in coronavirus relief measures
While testifying before the Senate Banking Committee, Dimon – who leads the nation’s largest bank by assets – raised concerns over potential U.S. inflation and suggested the Federal Reserve may need to raise interest rates sooner than expected to tamp down rising prices. Dimon said he expects inflation to climb “considerably higher” than 1.6%, thanks to massive amounts of federal spending and easy monetary policies.
The figure is poised to hit at least $30 trillion this year. Biden is now plowing ahead with passing his “Build Back Better” agenda, comprised of the $2.3 trillion American Jobs Plan and the $1.8 trillion American Families Plan. The measures would dramatically reshape the government-funded social safety net and rebuild the nation’s crumbling infrastructure.
“If that money is wasted, it is not productively spent, we will have more inflation, less productivity, slower growth and the American democracy you will have lost even more credibility eyes in the world,” Dimon said.
- 05/20/2021 – great comments on possible upcoming inflation jump. I need to fully digest the content
The Fed and our politicians are playing with fire
At the very least, a sooner-than-expected Fed tightening could lead to another round of panic such as we saw in late 2018. In retrospect, it is clear that the Fed back then had been tightening preemptively (unnecessarily worrying about higher inflation). That’s probably why they are so anxious to avoid tighening again—probably until it becomes painfully obvious that a tightening is necessary. And by that time, it’s likely they will have to tighten by more than they and the market would like. And that is exactly what has preceded and triggered nearly every recession in my lifetime. It’s all so unfortunate.
The Making of the Mother of All Economic Booms
- 03/23/2021
Powell Says Stimulus Package Isn’t Likely to Fuel Unwelcome Inflation – WSJ
- 03/16/2021 –
Putting the Risk Into Risk-Free Treasurys – WSJ