
Self-education on Implied Volatility and Options
http://www.investopedia.com/ask/answers/032515/what-options-implied-volatility-and-how-it-calculated.asp
Implied volatility is a parameter part of an option pricing model, such as the Black-Scholes model, that gives the market price of an option. The implied volatility shows where the marketplace views where volatility should be in the future. Since implied volatility is forward-looking, it helps to gauge the sentiment about the volatility of a stock or the market. However, it does not forecast the direction in which an option will be headed.
Implied volatility is not directly observable, so it needs to be solved using the five other inputs of the model: the market price of the option, the underlying stock price, the strike price, the time to expiration and the risk-free interest rate. The implied volatility is calculated by taking the market price of the option, entering it into the B-S formula and back solving for the value of the volatility.
There are various approaches to calculating the implied volatility. One simple approach is to use an iterative search, or trial and error, to find the value of an implied volatility. Suppose that the value of an at-the-money call option Walgreens Boots Alliance, Inc. (WBA) is $3.23 when the stock price is $83.11, strike price is $80, risk-free rate is 0.25% and the time to expiration is one day. The implied volatility can be calculated using the B-S model, given the parameters above, by entering different values of implied volatility into the option pricing model. For example, start by trying an implied volatility of 0.3. This gives the value of the call option of $3.14, which is too low. Since call options are an increasing function, the volatility needs to be higher. Next, try 0.6 for the volatility; that gives a value of $3.37 for the call option, which is too high. Trying 0.45 for the implied volatility yields $3.20 for the price of the option, so the implied volatility is between 0.45 and 0.6. This procedure can be done multiple times to calculate the implied volatility. In this example, the implied volatility is 0.541 or 54.1%.
Historical volatility, unlike implied volatility, is realized volatility over a given period and looks back at past movements in price. One way to use implied volatility is to compare it with historical volatility. From the example above, the implied volatility in WBA was 54.1% on March 5, 2015 at 1:13 p.m. Looking back over the past 30 days, the historical volatility is calculated to be 19.35%. Comparing this to the current implied volatility, it should alert a trader that there may be an event that can affect the stock price significantly; this could be a news event significant enough to elevate the implied volatility relative to the historical volatility for the past 30 days.
http://www.moneyshow.com/articles.asp?aid=optionsidea-25848
Analyzing Volatility and trading volatility
Implied volatility and historical volatility are studied using a volatility chart. A volatility chart tracks the implied and historical volatility over time in graphical form. It is a helpful visual aid that makes it easy to compare implied volatility and historical volatility. But volatility charts are often misinterpreted by novice traders.
Volatility chart practitioners need to perform three separate analyses. First, they need to compare current implied volatility with current historical volatility. This helps the trader understand how volatility is being priced into options in comparison with the stock’s volatility. If the two are disparate, an opportunity might exist to buy or sell volatility (i.e., options) at a “good” price.
In general, if implied volatility is higher than historical volatility it gives some indication that option prices may be high. If implied volatility is below historical volatility, this may mean option prices are discounted.
But that is not the end of the story. Traders must also compare implied volatility now with implied volatility in the past. This helps traders understand whether implied volatility is high or low in relative terms. If implied volatility is higher than typical, it may be expensive, making it a good a sale; if it is below its normal level, it may be a good buy.
Lastly, traders need to complete their analysis by comparing historical volatility at this time with what historical volatility was in the recent past. The historical volatility chart can indicate whether current stock volatility is more or less than it typically is. If current historical volatility is higher than it was in the past, the stock is now more volatile than normal.
If current implied volatility doesn’t justify the higher-than-normal historical volatility, the trader can capitalize on the disparity by buying options priced too cheaply.
Conversely, if historical volatility has fallen below what has been typical in the past, traders need to look at implied volatility to see if an opportunity to sell exists. If implied volatility is high compared with historical volatility, it could be a sell signal.
My comments: however, the above trade on Options due to the volatility and volatility chart only work with assuming all other parameters of Options do not change much.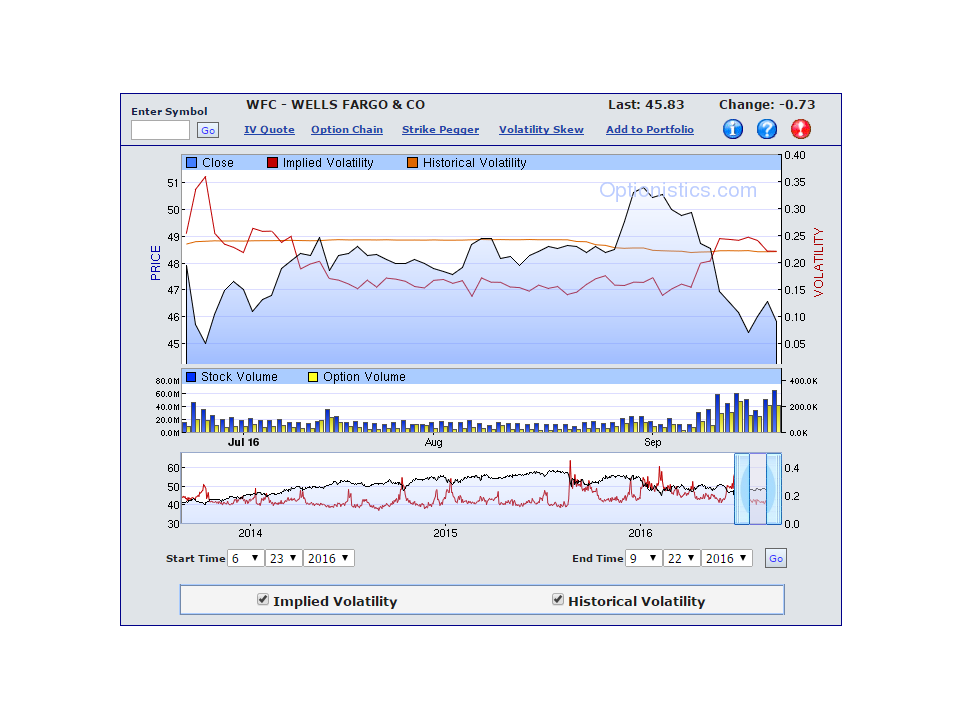
VIX futures vix-futures
https://tickertape.tdameritrade.com/thinkmoney/2014/01/vix-futures-advantage-44353
With the VIX index, VIX options, the VVIX (volatility of the VIX), and now VIX futures, you can increase market awareness and make more informed trading decisions.
The Soup and the Nuts
In a word, SPX options drive the VIX. The VIX (or anticipation of what the VIX might be) drives VIX futures. VIX futures drive VIX options. And VIX options drive the VVIX.
The VIX measures the implied volatility (“vol”) of the S&P 500 index (SPX) options. The VIX at 14.00 should be interpreted as 14%, and is the market’s collective estimate of how much the price of the S&P 500 might move up or down over a succeeding 30 days. The VIX is calculated from the prices of out-of-the-money (OTM) SPX options. So when the prices of SPX options go up, say, because traders expect a price move upward, the VIX goes up. When the prices of SPX options go down, the VIX goes down. The VIX formula does a weighted average of the first two expirations of SPX options to arrive at a hypothetical constant 30-day-to-expiration volatility. Some investors only watch the VIX relative to the S&P 500. But that’s only half the picture. VIX futures are the other half.
The symbol for VIX futures is /VX. On the Trade page of thinkorswim, you’ll find the available futures out five or six expirations with different prices at each (Figure 1). When the prices of the further-expiration futures are higher, that’s called “contango.” When the prices of the further-expiration futures are lower, that’s called “backwardation.” In most financial-futures products, contango and backwardation are determined from the “cost of carry”—the cost incurred by owning the underlying stocks or bonds.
VIX futures don’t have a cost to carry. Their contango, or backwardation, is determined by the market’s anticipation of what vol might be. For example, if you’re speculating on the VIX, don’t just look at the VIX index. Look at VIX futures, too. Market uncertainty can create contango in VIX futures where expectation of future market vol exceeds the level of the VIX index.
Back in late 2008, when the VIX spiked higher due to market fear, VIX futures were in backwardation, indicating there might be less vol in coming months. Investors who don’t want to trade the VIX may use VIX futures to anticipate higher or lower vol in the near term, and adjust strategies accordingly.
Connecting the Dots
Retail traders can’t trade the VIX itself, so they often speculate using VIX options. But you can’t look at VIX options alone. When you’re looking at the VIX options on the Trade page, you’ll see expirations out roughly to six months (Figure 2). VIX options are European-style and cash-settled, with Wednesday expirations 30 days prior to the third Friday of the calendar month following the expiration of VIX options. (To see the VIX settlement value, use the symbol “VRO.”) Confusing, so it’s a good thing the expirations are clearly labeled for you in the option chain of each series itself.
Sometimes VIX option prices don’t make sense relative to the VIX. Why? Because of the golden rule of market making—price options off your hedge. As market makers buy and sell options, they hedge trades to avoid directional (delta) risk. If you make markets in VIX options, and you can’t trade the VIX itself, what’s your hedge? Bingo—VIX futures.
That’s why VIX options look at the prices of VIX futures to determine pre-expiration value, not the VIX index. And that’s why seeing VIX futures easily is exciting. thinkorswim is one of the few retail trading platforms to offer VIX futures—which help to make VIX option pricing more transparent. Here’s how.
Recently, the VIX was 14.25. The 16 put with 19 days to expiration was trading for 1.70, and the 16 put with 54 days to expiration was trading for 1.55. Aren’t options at the same strike with more days to expiration supposed to have a higher value than options with fewer days to expiration? Yes, if you’re looking at equity options. VIX options in a particular expiration are priced off the VIX futures with the same expiration. If you’re looking at March VIX options, those are priced off March VIX futures. And because of the contango or backwardation in VIX futures, the VIX options may look mispriced if all you’re looking at is the spot VIX.
While the VIX was at 14.25, the VIX futures that expired in 19 days were 15.00, and the futures that expired in 54 days were 16.10. Because the VIX futures with 54 days to expiration were trading higher than the futures with 19 days, the VIX puts with 54 days to expiration were trading lower (1.55) than those with 19 days (1.70).
The Knee Bone, Shin Bone, and VVIX
Without VIX futures, it’s hard to make sense of VIX option prices. Seeing the price of the VIX futures that have the same expiration as the VIX options, you can tell which VIX options are considered in the money (ITM) and out of the money (OTM). This helps determine the strike prices you choose for VIX option strategies.